
Tim Ord @OrdOracle
Author of award winning newsletter and how to book regarding market timing analysis. ord-oracle.com Lincoln, Nebraska Joined April 2009-
Tweets2K
-
Followers7K
-
Following269
-
Likes19
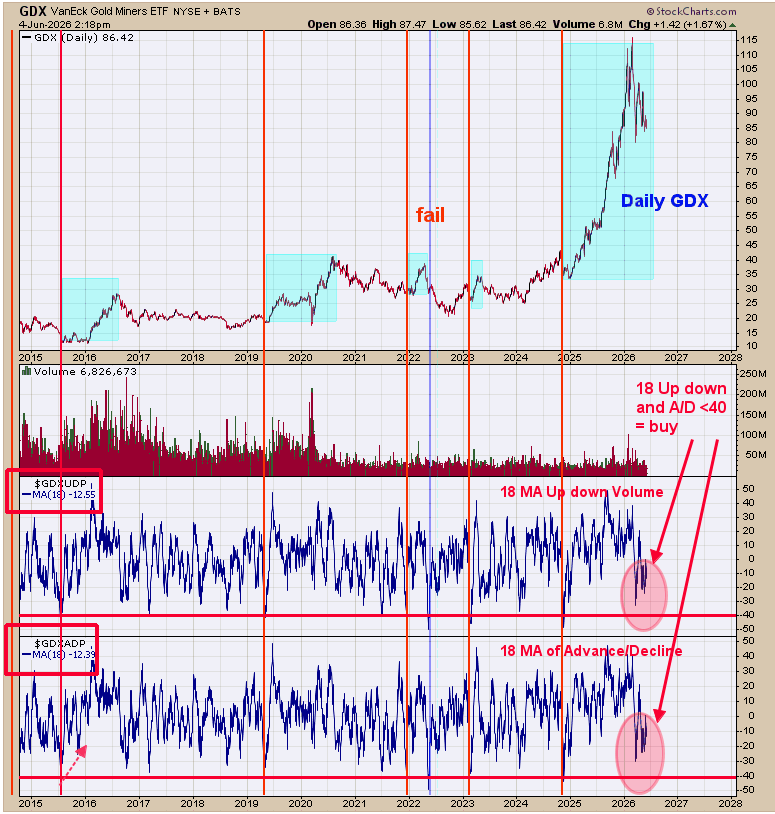
The bottom window is the GDX advance/decline with an 18 day average; next higher window is the GDX up down volume with an 18 day average, top window is the daily GDX. We noted with red lines when both indicators reach below -40 showing panic in the advance/decline and up down volume. The minus 40 levels in both indicators show exhaustion to the downside and in turn where bottoms form. We shaded in light blue on the daily GDX when these exhaustion readings on these indicators occurred. What may transpire in the coming days are for both indicators reach -40 levels and setting up the next rally phase for $GDX. Both indicators are coming in near the -12 range right now and near -30 points away from our target range.
@eifers1 anything below 10 on BPGDM have been at intermediate term lows
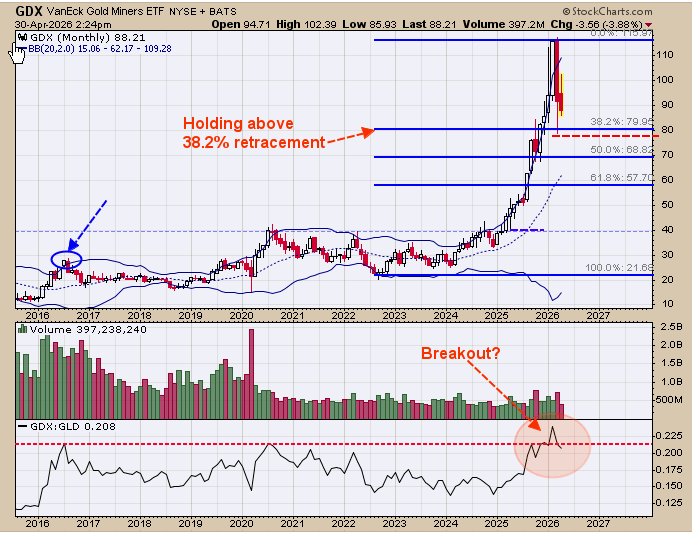
The bottom window is the monthly GDX/GLD ratio and next higher window is the monthly $GDX. In bull market the GDX/GLD ratio rises and in bear market this ratio declines. The GDX/GLD ratio has been in a sideways trading range going back to 2014 (12 years) and is due for a breakout. We circled in pink where we are now. This ratio has traded above the two previous highs of 2020 and 2016 which came in near .21 levels. This ratio has been hovering near .22 since late 2025 and not backing away form the breakout area. If a market holds near the breakout area; it implies the market is eating through the supply and in turn the resistance level. It appears GDX/GLD may be breakout out of the .22 level; next upside resistance is the .40 range. If the .40 range is achieved, than GDX would near double form current prices. We are keeping our eye on the bigger timeframes as a large rally in GDX is not far off.
@jimmys3000gt yes Gold stocks should outperform the QQQ in the coming months, according to the charts.
@jimmys3000gt Not sure yet but could be 80 range on GDX
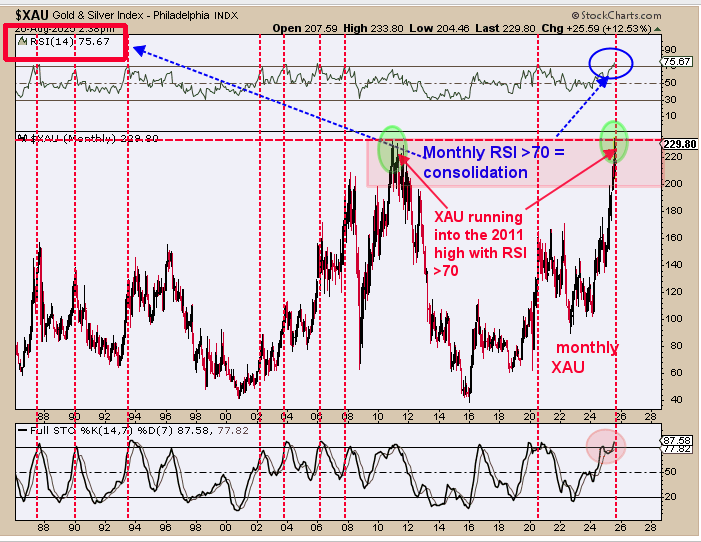
$GDX is at a low (see previous reports); having said that, a trading range may be starting. The top window is the monthly XAU going back to 1982; middle window is the monthly Silver/Gold ratio; bottom window is the percent Bollinger band (reading of 1 is above the upper Bollinger; 0 reading is below lower Bollinger) and next higher window is the “Rate of Chance” (ROC) for the monthly $Silver/Gold ratio. We noted the times going back to 1982 where the ROC and Percent Bollinger band for the monthly Silver/Gold ratio reached above the upper red dotted lines (note vertical noted red lines). Looking at the monthly XAU we noted those time on the $XAU chart with shaded blue area. Notice in all cases the XAU consolidated for several months. In summery, though GDX (XAU) is at a low a trading range is most likely beginning that can last several months. Once the consolidation is completed new highs is expected.

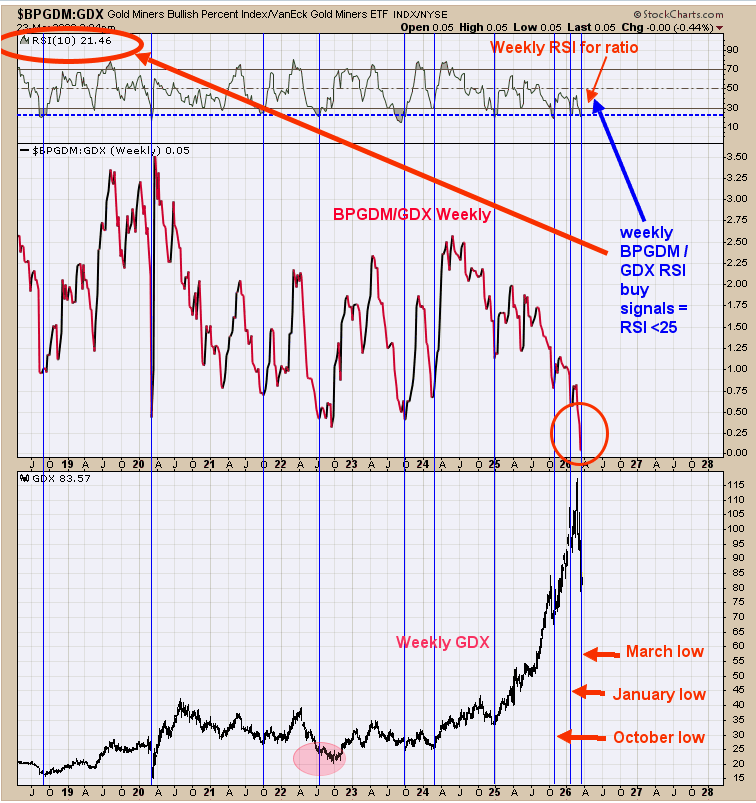
Pull back in $GDX appears complete. Bottom window is the weekly GDX, next higher window is the weekly bullish percent index for the Gold Miners index/GDX ratio and the top window is the 10 period weekly RSI for the ratio. We noted the times with blue lines when the weekly RSI for the weekly Bullish percent index for the Gold Miners index/GDX reached below 25. This chart goes back to mid 2018. Since 2018 until now the RSI reached below .25 nine times (not counting current signal) and eight times the market was at the low and one time is was near the low (back in 2022 pink circle). Over the last five months there have been three signals and the October and January signal worked perfect leaving the current signal to be determined. The odds suggests a low is forming here.
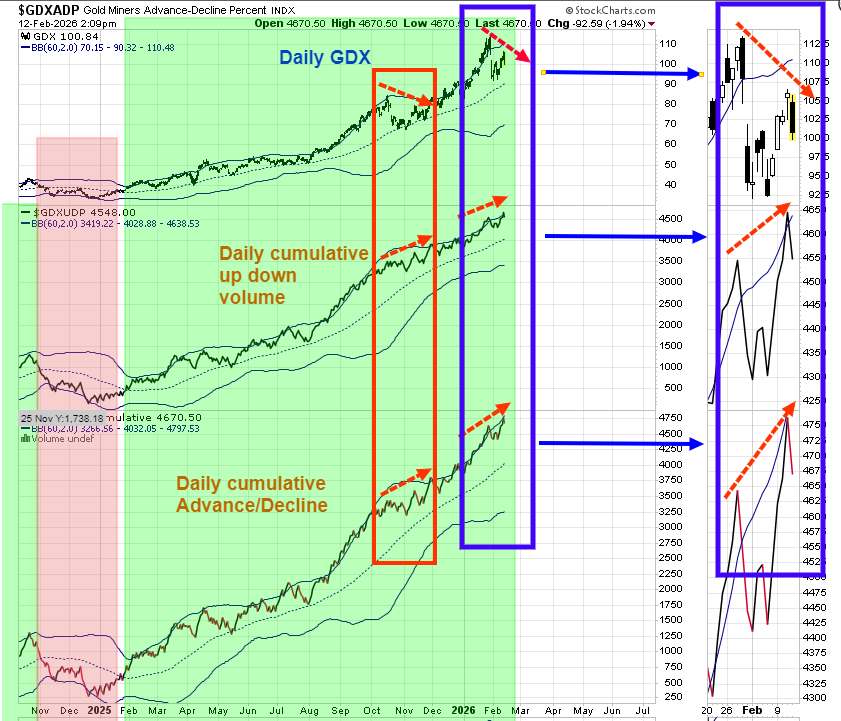
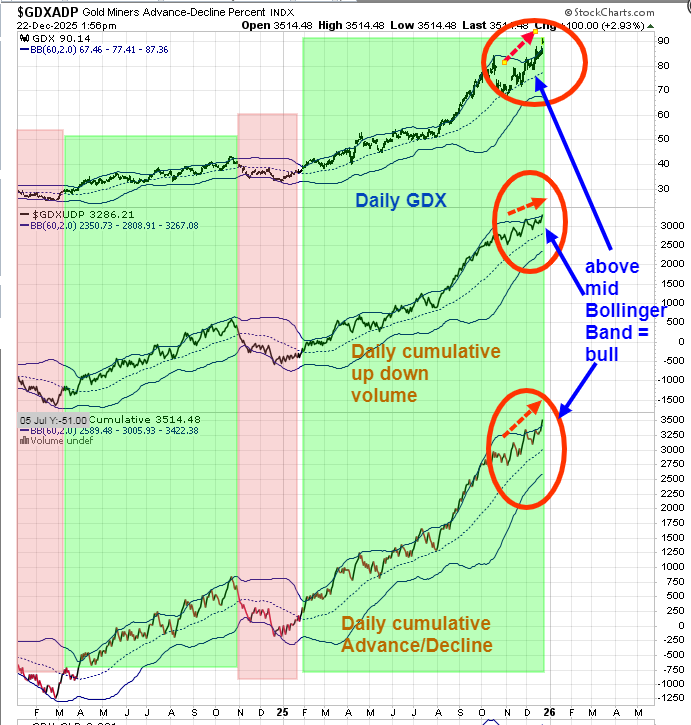
The bottom window is the daily cumulative advance/decline for GDX and next higher window is the daily cumulative up down volume for GDX and top window is the GDX. We noted with a red box the previous time where both daily cumulative up down volume and cumulative advance/decline made higher highs while $GDX made a lower high. This positive divergence was a bullish sign for GDX’s rally to continue; which it did. Looking at the far right window in the blue box we have the same setup where the cumulative advance/decline and cumulative up down volume have made higher highs suggests GDX at a minimum will get back its old high if not higher.
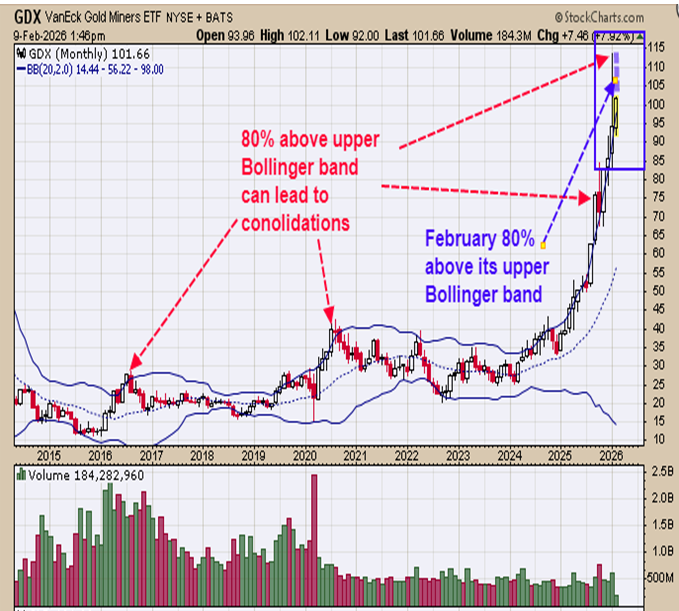
Last Thursday’s commentary we pointed out that the shaded green area on the BPGDM/GDX window show where previous bottoms have formed and we are in that area now (see last Thursday’s report). Having said that. GDX may be due for a consolidation. Above is the monthly GDX with its Bollinger band. We noted with red arrows the times when 80% of GDX trading range was above its upper monthly Bollinger band. Last month $GDX graded above 113 which had it closed there would have seen 80% of January trading above its upper Bollinger band. Since 80% of its January trading range was above its upper Bollinger band the market was stretched and did retrace at the end of the month. There is evidence that the January high may be tested. If indeed January high is tested this month it will have again be 80% of its trading range above it upper Bollinger band. This is one of the reasons that a trading range may be developing. With the BPGDM/GDX ratio in bullish territory no top of any consequence is expected but a sideways pattern is possible. Longer term trend remain bullish.
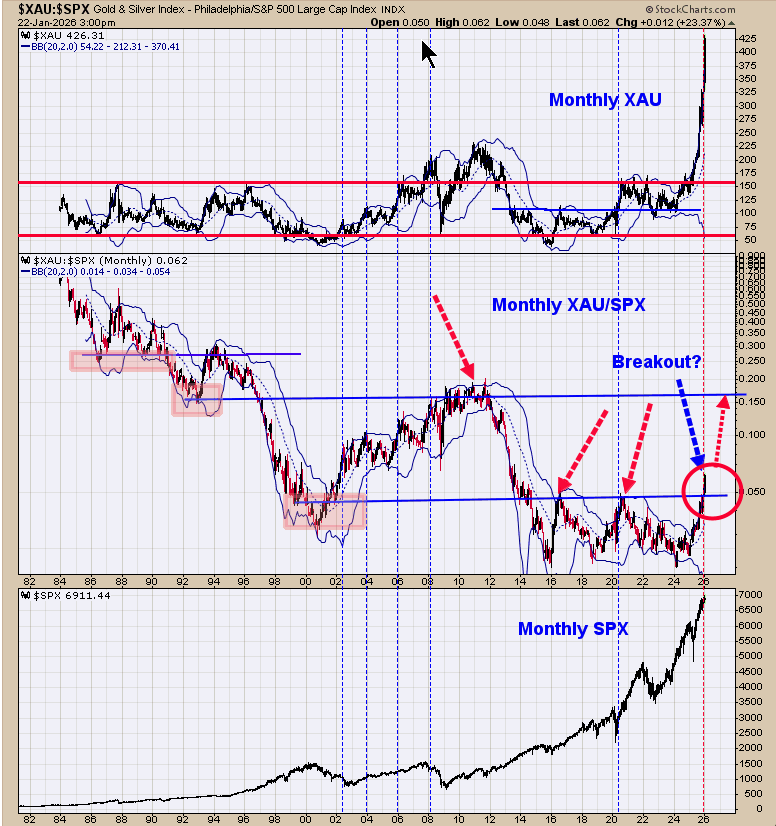
The middle window is the monthly $XAU/SPX. When this ratio is rising than $XAU is outperforming SPX and when this ratio falling than SPX is outperforming the XAU. This ratio has been rising since the start of 2024 (2 years) showing that gold stocks have been outperforming SPX stocks. The red circle on the chart shows a breakout where it closed above its previous highs of 2016 and 2020 highs near .05. This breakout suggests the XAU/SPX ratio will go (at some point) to the next higher resistance which is the 2010 high near .15. So what does that mean? If the .15 level is reached it will mean that gold stocks ($XAU) will outperform the $SPX stocks by 300%. Gold stocks may be the place to be over the next several years.
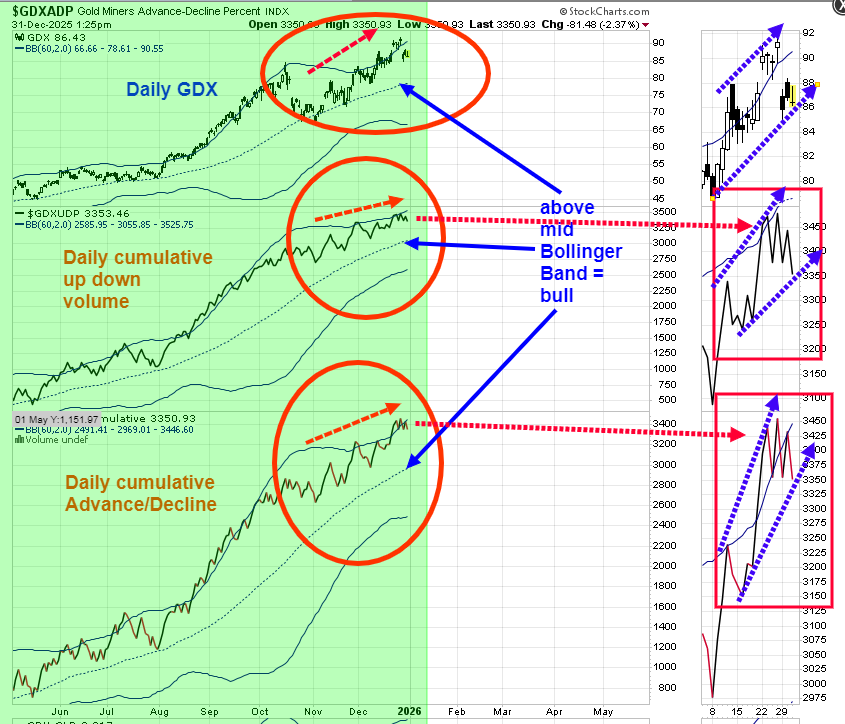
Looking at the chart above to the far right window you will see a blown up window that show the smaller time frame for the daily cumulative advance/decline and cumulative up down volume for GDX along with GDX at the top. Notice that both indicators are making higher highs and higher lows (blue arrows) along with GDX which is the definition of a bullish uptrend. This setup suggests GDX may start to move higher in the coming days. The previous commentary still apples, “Momentum rules all indicators. We are looking at the smaller time frame in search of pending divergences. The bottom window is the daily cumulative advance/decline and next higher window is the daily cumulative up down volume, both for the GDX; the top window is GDX. We shaded in green when both indicators are above their mid Bollinger band showing an uptrend in GDX. GDX did pull back today, but both indicators stayed near there highs, showing strength. Tops forms in markets by making multi tops and so far we have just one top. Seasonality turns bullish for gold again in early January suggesting rally has further to go.
Momentum rules all indicators. Above are two momentum studies; bottom window is the daily cumulative advance/decline and next higher window is the daily cumulative up down volume, both for the GDX; the top window is GDX. We shaded in green when both indicators are above their mid Bollinger band showing an uptrend in GDX and shaded in pink when both indicators are below their mid Bollinger band. Both indicators a well both their mid Bollinger band showing GDX is in an uptrend.
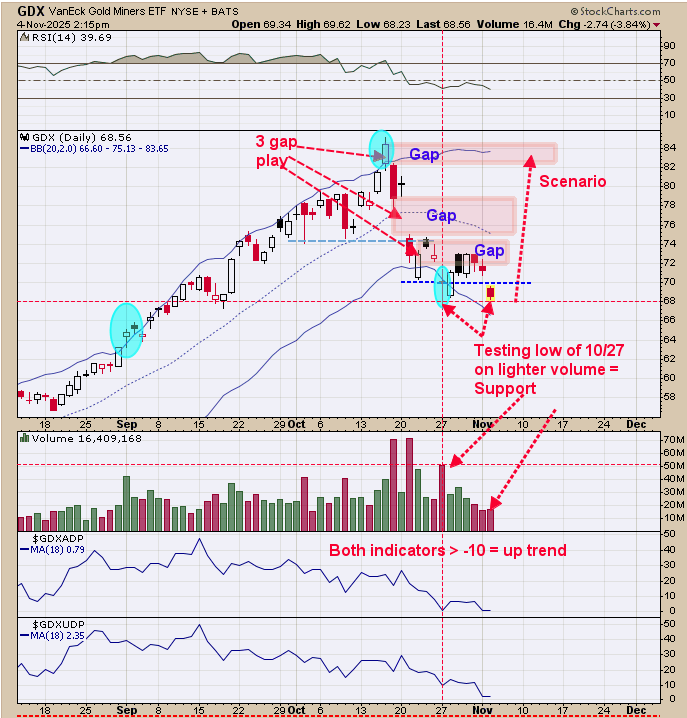
A short term low is near. On October 27, GDX made a low of 68.13 on volume 51 million shares. To have a valid break through the 10/27 low of 38.13, volume should be at least equal to the 10/27 volume of 51 million shares and that appears unlikely. Most likely a low near current level is forming. $GDX also produced a “Three Gap Play” to the downside; this pattern predicts on the third gap down the market will reverse and rally back to the first gap. The first gap came in near the 84.00 range. Long GDX on 9/29/25 at 75.76. find us on Twitter at @OrdOracle.
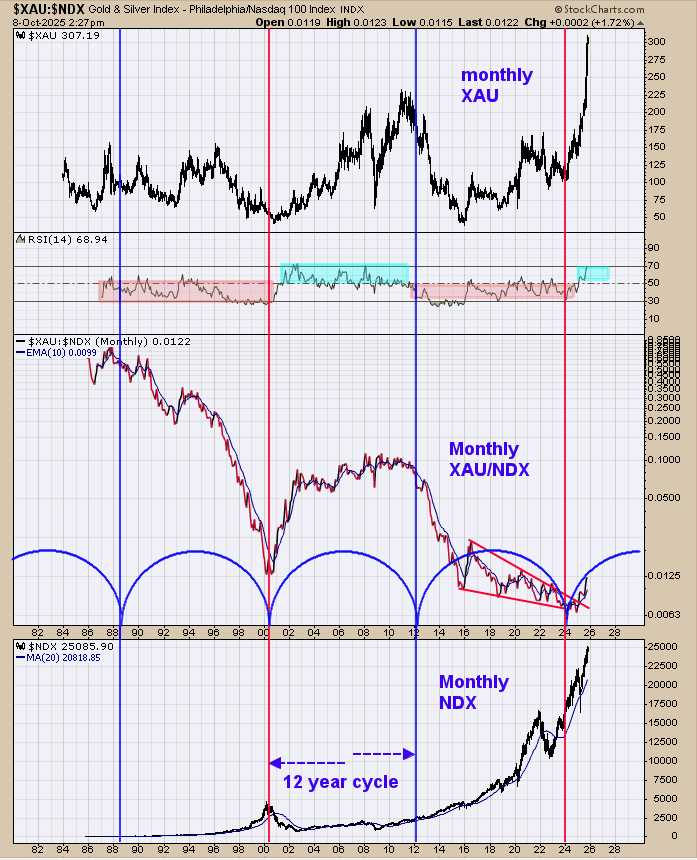
The top window is the monthly $XAU next lower window is the monthly XAU/NDX and bottom window is the monthly NDX. The monthly XAU/NDX has it’s RSI in the next window up. When the XAU/NDX is rising than XAU is out performing the NDX and the RSI will stay above +50. When this ratio is falling than NDX is outperforming the XAU and the monthly RSI stays below +50, We shaded in pink the RSI when it’s below 50 and shaded in light green when above +50. There appears to be a 12 year cycle where XAU outperforms the $NDX and than NDX outperforms the XAU. This ratio turned up in early 2024 and the RSI closed above +50 earlier this year and has hit near +70 recently suggesting a 12 year period where the XAU may outperform the NDX.
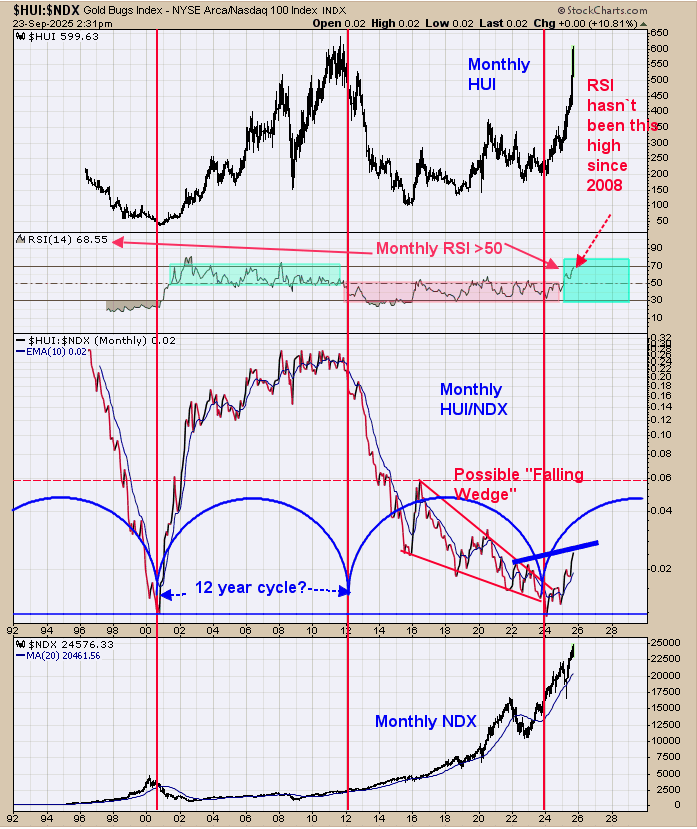
The short term trend remains up for $GDX. Above is a long term view of the gold market. The second window up from the bottom is the month HUI/NDX ratio (dating back to 1996). There appears to be a 12 year cycle where HUI outperforms $NDX (when this ratio is rising) and then 12 years where NDX is outperforming HUI (falling ratio). This ratio has turned back up in early 2024 suggesting a 12 year cycle has started and that the HUI may outperform NDX for the next 12 years and last into 2036. The window above the monthly HUI/NDX is the RSI for this ratio. Recently this RSI has broke above the 50 level reaching to 68 currently, showing that the HUI/NDX is rising; also notice that the HUI/NDX has traded above a previous high (noted with blue line) which is the definition of a rising market. We will keep on eye on this ratio going forward and will notify you if thing change. A lot of gold stock are now penny stocks and if the chart above plays out many of these gold penny stocks could become $1, $10 for more. We don’t have it shown but the XAU/Gold ratio is cheap compared to history.
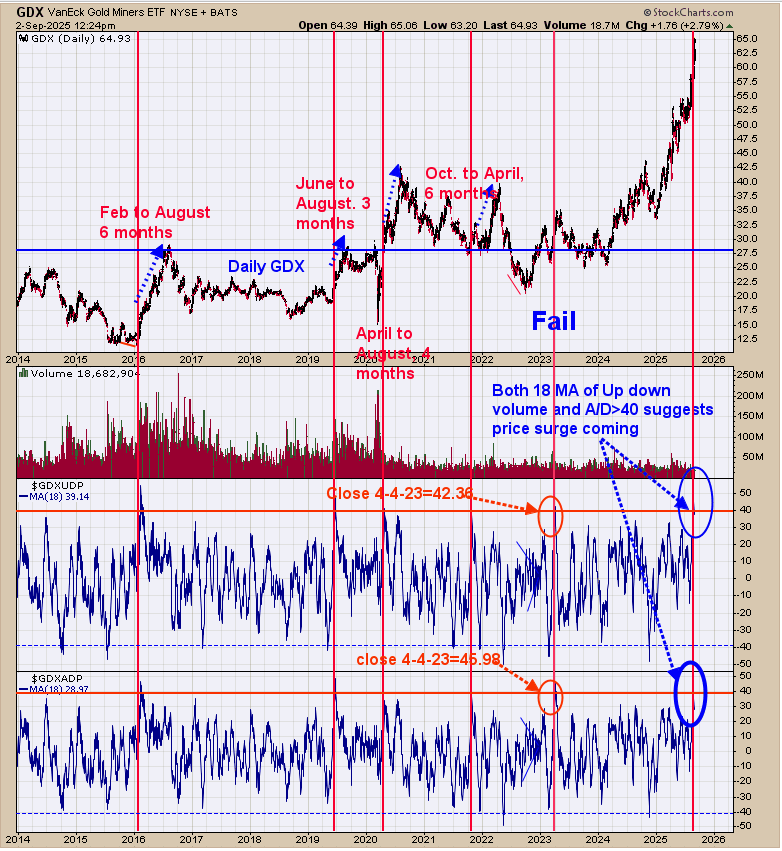
The bottom window is the 18 ma of the Advance/Decline for GDX and next higher window is the 18 ma of the up down volume for GDX. This chart goes back to 2014. We marked the times with red lines when both indicators reached +40 (bottom indicator reached 39.48 yesterday and current reading on other indicator is 44.99). What happens next is sometimes a mild consolidation before another surge higher that cans last 3 to 6 months. This is a rare occurrence as it has happened five times (not counting the current event) since 2014. Of the five times it occurred there was one failure in April 4 2023 (noted on chart); so that works out to be an 80% chance the current market will produce a surge in the coming weeks that may last 3 to 6 months. Want point out that the mild consolidation can last several weeks. We are thinking the senior sector may rest; where the junior sector will perform. This information suggests no top of any significant for GDX.
We marked the times when the monthly RSI reached above +70 (current reading is 75.67) with red dotted lines. In all cases the $XAU at least stalled and in most cases a consolidation started that lasted several months. Notice also that the monthly XAU is running into the 2011 highs which is a resistance zone. Full Stochastic is also above 80 (current reading is 87.58) which shows the XAU is extended to the upside. Should see a consolidation starting in the XAU that may last several weeks if not months.
Gold Ventures 🟡 @TheLastDegree
148K Followers 217 Following 💛 Investor in tenbagger 1.000% Junior #Microcap #Miners #Silver #Gold #Lithium #Copper Retired 38 | not paid not sponsored = unbiased | NOT FINANCIAL ADVICE
Northstar @NorthstarCharts
157K Followers 703 Following Military meteorologist. Applying scientific, predictive principles to forecast market movements. Macro economics & trading. A picture paints a thousand words.
Willem Middelkoop @wmiddelkoop
197K Followers 10K Following Swiss-born ex (TV) journalist - ‘The Oracle from Amsterdam’, coined BTC ‘Virtual Gold’ (2014), The Big Reset (8 languages) - Discovery Investor (AUM $200mln+)
DowGoldEquals1 @DowGoldEquals1
22K Followers 95 Following Amateur technical analyst charting the secular PM bull market.
Lawrence Lepard, "fix... @LawrenceLepard
253K Followers 29K Following Investment Manager, Equity Management Associates,LLC. Sound money advocate. Gold stock fund manager. Austrian economist. Anti-Federalist. CrossFit Athlete. #BTC
Tom McClellan @McClellanOsc
148K Followers 287 Following Technical Analyst - Editor of The McClellan Market Report. Trying to figure out stock market physics, and to leave my campsite cleaner than how I found it.
Rashad Hajiyev @hajiyev_rashad
104K Followers 119 Following Active investment management, analysis of financial markets as well as independent research. Posts are not investment advice!
TheHedgelessHorseman ... @Comm_Invest
23K Followers 1K Following #Gold #silver & #mining ⚒️ focused investor. Based in #Sweden. Not investing advice. Always do your own due diligence. Email: [email protected]
Brian Shannon, CMT @alphatrends
410K Followers 839 Following Trader, Author, Orophile, Technical Analysis Multiple Timeframes https://t.co/E4cQoecQva Only Price Pays® Maximum Trading Gains w/⚓VWAP https://t.co/4RBYa3EFPj
Edward Gofsky @EdwardGofsky
27K Followers 6K Following Researching & writing about Wall Street since 1997. You have to be your own Central Bank. Live on a Gold & Silver Standard. El Salvador.
Lawrence McDonald @Convertbond
144K Followers 14K Following NY Times Bestselling Author, pick up "When Markets Speak" on Amazon. Long-time @RealVision @CNBC Contributor, founder of the @BearTrapsReport
J. Fong @jfhksar88
8K Followers 3K Following
bob coleman @profitsplusid
41K Followers 385 Following Idaho Armored Vaults stores all physical precious metals outside the financial system in insured, segregated, and armored vaults.
Kerberos007 @kerberos007
32K Followers 3K Following To transform massive raw data into meaningful trading information which in turn enables one to build investment knowledge. This is for educational purposes only
Eric Yeung 👍🚀�... @KingKong9888
88K Followers 3K Following Geopolitical and economic effects on Precious Metals and commodities. Not financial advice. Opinions are my own.
Axel Kising @Axxel1111
66 Followers 224 Following
veerendra marni @veeru_marni
14 Followers 1K Following
Public Sentiment Dash @PublicSentDash
157 Followers 755 Following Bio: AI-assisted public market sentiment dashboard for stocks, forex, crypto, commodities, bonds, and macro headlines. Informational only. Not financial advice.

(*Φ皿Φ*) @Averysmom0228
84 Followers 321 Following
Cyril Christoff @ChristoffC95117
14 Followers 20 Following
Maury🦂🌘⚔️�... @bluegiaguar
93 Followers 390 Following Non temo la fatica, la morte o il dolore , ma solo il disonore.
Joann @j99628719
0 Followers 1 Following
Jason Pickering @JasonPickering
32 Followers 207 Following
MaZaIn @MaZaIn349744
59 Followers 1K Following
Ray M @PapaMoose_1
12 Followers 45 Following USN Retired, Futures Trader now I love Jesus Christ Fishing Chesapeake Bay Traveling for fun 5 Grandchildren, 1 boy and 4 girls.
sam @sam77744538
104 Followers 59 Following
Trader_RC @ShakaShakaBrah
1 Followers 44 Following

dr james elbaor @sportsdoc58
18 Followers 113 Following Harvard. Educated orthopedic surgeon scientist entrepreneur, investor,

Northern Lights Resou... @LightsResources
287 Followers 650 Following Northern Lights Resources $NLR.CN $NLRCF FSE:0ZH0 advancing a portfolio of Cu & Au projects in proven North American districts, targeting a major discovery
VeerVijay @Veer_Vijay2023
41 Followers 74 Following
Roderick Alan @RoderickAlan55
45 Followers 538 Following The truth at any cost lowers all other costs.
Maury Hurt @maurywhurt
72 Followers 496 Following
Wulff @Wulffmango
21 Followers 227 Following
SilverChurch @Augustus_65
40 Followers 164 Following
Pat Vercamer @PatVercame53102
0 Followers 621 Following
Sasikumar @Kumarsasi2025
189 Followers 1K Following Likely value what’s real over what’s flashy, make others feel at ease just by being straightforward in a world that tries too hard, I am refreshing
Billy Cardno @bilcardno
240 Followers 1K Following
Toke Odin @TokeOdin
81 Followers 346 Following

Abanob Atef ™ @Abanob2022
88 Followers 610 Following مجتهد في التحليل الفني _ مستثمر في العملات الرقمية(BTC) 🤑
Quant Intelligence ~ ... @QuantOsInt
566 Followers 6K Following PhD can. Financial Econometrics - decoding/forecasting Markets, Prices & Risk - ML|DL|AI OSINT/MENA NoFinAdvise 🇩🇪 🇬🇧 🇪🇦 🇨🇵 🇲🇦
skyscrapper @skyscrapper7081
303 Followers 3K Following

Vincentius Arnold @vincentiustnwjy
910 Followers 6K Following @ @InclusiveHRIndo, building #inclusion& #LOHAS thru' a #coop. Againts corruption, poverty & inequality, #MSA & #HE. #LocalCurrency design student.
Jim @Jim530567811473
287 Followers 2K Following
Bill James, CFA, CMT,... @BillJams
103 Followers 173 Following Creating reality easily. Exploring life. Always Learning! Author of Get Luck Now! On Amazon here: https://t.co/Np6Ql3j9Hj
sceciliafq @sceciliafq
20 Followers 137 Following
KrispyMarkets @KrispyMarkets
1 Followers 170 Following
Futview @futviewer45
21 Followers 135 Following
Jeff Coley @Piglet10a
665 Followers 2K Following
Tustumena @Tustumena907
91 Followers 477 Following
Homer Simpson’s Bro... @McCaffalope
512 Followers 4K Following
Jennie Cox @Jennie22354
61 Followers 306 Following
KnowsNothing @knowsnothing1
350 Followers 6K Following
kokokoko @George_Gerges
22 Followers 477 Following
Anders Olesen @ArosGTs
21 Followers 78 Following

walter sanders @SandmanWalt1
14 Followers 74 Following
sdpk @TheincrediblePk
239 Followers 2K Following Any stock related posts are not investment/trading advice.
Mike Konjanovski @mikekonj
105 Followers 387 Following
Northstar @NorthstarCharts
157K Followers 703 Following Military meteorologist. Applying scientific, predictive principles to forecast market movements. Macro economics & trading. A picture paints a thousand words.
Graddhy - Commodities... @graddhybpc
109K Followers 27 Following 31y in markets, commodities sector investor/swing trader, unique combination of cycles + technicals = leading edge, 20y in mgmt consulting, join at https://t.co/dZoc2yuE1z
Patrick Karim @badcharts1
132K Followers 284 Following Chart trader. Scientific "weight of evidence" market analysis incorporating risk & money management.
Walter Deemer @WalterDeemer
122K Followers 109 Following Retired institutional market analyst (1964-2016)
Tom McClellan @McClellanOsc
148K Followers 287 Following Technical Analyst - Editor of The McClellan Market Report. Trying to figure out stock market physics, and to leave my campsite cleaner than how I found it.
Brian Shannon, CMT @alphatrends
410K Followers 839 Following Trader, Author, Orophile, Technical Analysis Multiple Timeframes https://t.co/E4cQoecQva Only Price Pays® Maximum Trading Gains w/⚓VWAP https://t.co/4RBYa3EFPj
Kerberos007 @kerberos007
32K Followers 3K Following To transform massive raw data into meaningful trading information which in turn enables one to build investment knowledge. This is for educational purposes only
Jesse Felder @jessefelder
172K Followers 20 Following Founder and editor of The Felder Report and host of the Superinvestors and the Art of Worldly Wisdom podcast.
Chris Ciovacco @CiovaccoCapital
79K Followers 577 Following Founder & CEO Ciovacco Capital Management. Georgia Tech.
Ian McMillan, CMT @the_chart_life
131K Followers 611 Following Technical Analysis | PM @adaptiv | ETF $ADPV @ADPV_ETF | Children’s book author | Alum @UofSC & @Citadel1842 | Tweets are not advice
Gary Bohm @GaryBohm5
14K Followers 2K Following Founder & Host of Metals and Miners YT Podcast | https://t.co/Xs0etA1UtP for: metals, miners, economy, consumers, A.I, more. #Gold #Silver #Copper #Uranium
Kevin C. Smith, CFA @crescatkevin
47K Followers 2K Following Founder, CEO, and CIO of Crescat Capital. Investment decision maker for Crescat's macro, mining, and long/short hedge funds since inception. https://t.co/ptnKKXAGWv
Wayne Whaley @WayneWhaley1136
17K Followers 93 Following MS Ops Research Ga Tech 2010 Charles Dow Award - Planes, Trains & Automobiles TOY Barometer, Whaley Breadth Thrust [email protected]
Grayson Roze @GraysonRoze
9K Followers 581 Following Chief Strategist @StockCharts | Author of “Trading For Dummies” and “Tensile Trading” | @Porsche Geek 🏎️ | Watch Nerd ⌚️ | Drummer 🥁
Market Participants @mktparticipants
2K Followers 193 Following Sharing #charts #trading #stocks #options #crypto #fintwit Former prop trader 20+years CDN bank. NOT investment advice, only personal opinions/views 📈📉🐂🐻
Casey Stubbs @caseystubbs
21K Followers 816 Following Im a Real Guy Helping Real People, Win in the Market. Author of The Complete Trading System
Linda Raschke @LindaRaschke
134K Followers 128 Following Private Trader, lifelong student of markets, retired top performing hedge fund manager, featured in New Market Wizards
Jim Carroll @vixologist
30K Followers 5K Following Portfolio manager with momentum and vol strategies. Also hack guitar player who sings. Tweets/RTs are not investment advice. You need to do your own work!!
Dean Christians, CMT @DeanChristians
21K Followers 580 Following All charts, signals, and related commentary are not investment advice.
CARDONE @cardoneparts
3K Followers 642 Following Manufacturer & remanufacturer of auto parts for passenger cars and light/med duty trucks. 43k+ SKU's in 9 product divisions available.
Tradewell @TradewellApp
2K Followers 46 Following 👋 Official account of Tradewell. We 💚 RTing market insights generated by users of our web app! Insights ≠ advice.
Eric De Groot @supreed
3K Followers 24 Following A forum that uses the markets as the ultimate teacher and provides unique perspective on #BITCOIN, #Bonds, #Stocks, #Commodities, global trends, and #Cycles.
Macro Charts @MacroCharts
194K Followers 960 Following 30 years in markets. ex-Fund Manager, now independent. Focus on BIG trends, actionable ideas, and execution.
The Dog 🐶 @TAtheDog
12K Followers 206 Following 🐶 I teach auction market theory & game theory Explaining market behavior, acceptance & failure @TheoryAffinity 📡 https://t.co/SIZb5o9zYC
Ondra @Overtrader_83
2K Followers 168 Following Economy, stocks, stats & python. Happy to offer ideas, not advices.
Trading Volatility @TradeVolatility
34K Followers 540 Following Market structure & options positioning for serious traders. Gamma | Option flow | 0DTE | Skew | Vanna | VIX/VXX/SVIX🇺🇸

twillo @twillo1
997 Followers 57 Following
Brrr Infinity Capital @InterestRateArb
10K Followers 8K Following Affiliate of https://t.co/im7HXDpxQS "Some people get rich studying artificial intelligence. Me, I make money studying natural stupidity." - Carl Icahn
Bespoke @bespokeinvest
264K Followers 1K Following Bespoke Investment Group - Financial Markets Research. Learn more here: https://t.co/cQM6mJs66O
Nautilus Research @NautilusCap
51K Followers 744 Following A Research boutique providing institutional investors with insight for today's markets. Not investment advice. https://t.co/GMYzzgharS
Wealth365 @Wealth365Inc
534 Followers 349 Following Wealth365 is a convenient place for traders, investors, and entrepreneurs of all levels to learn about the topics they want to in an all-online way. #Wealth365
Quantifiable Edges @QuantifiablEdgs
21K Followers 132 Following Assessing Market Action with Indicators and History
Schaeffer's Investmen... @schaeffers
14K Followers 481 Following Options & sentiment research since 1981. Contrarian analysis of volatility, positioning & options flow. The Contrarian Edge: https://t.co/iYi8QhDPD6
Cam Hui, CFA @HumbleStudent
14K Followers 299 Following Retired left & right brained modeler of quantitative investment systems. Publishing monthly column at https://t.co/MyHCHT6DX8
Elliott Wave Internat... @elliottwaveintl
51K Followers 373 Following EWI is the world's largest market forecasting firm providing forecasts of every major financial market in the world. https://t.co/emSJdPTBzi
Gianclaudio Torlizzi @TCommodity
15K Followers 52 Following Fondatore di T-Commodity. Consigliere del Ministro della Difesa. Autore di #MateriaRara. Centro Studi Militari Marittimi. Fondazione Machiavelli.
Victor Zubarev @VictorZubarev
10K Followers 2K Following Market Technical Analyst, Trading Systems Developer, Equities, Indexes Futures, FOREX, Cryptos 4LP Earth Ox LEO born on 28th
Rob Topping @ToppingCapital
2K Followers 5K Following Alts & VC / Connect with me: https://t.co/Hzn9PT6ytR The “Nu40” -Tweet of #life, #art, #finance and #newassetclasses. 28 yrs - hedge fund = survivor
WFN1 News @WFN1LIVE
2K Followers 3K Following WFN1 News Corp & 'CEO Money' 1190AM IHeart Radio Dallas, TX A Financial News Syndication Network, Listen Live @ 12PST https://t.co/4dPGRyAAoa
Erin Wood @USCErin
125 Followers 166 Following Mom of two children. A Cancer Mom since Sep. '06. Sammy's in remission since Aug '07! Yay!Dan Zanger @DanZanger
243K Followers 8 Following World Record Top Swing Trader Turned $10,775 to over $18,000,000. All posts are from my protégé Randy Opper (CM). This is my only account, beware of imposters!!
Jeffrey A. Hirsch @AlmanacTrader
47K Followers 1K Following CEO Hirsch Holdings, Publisher Almanac Trader, Editor Stock Trader’s Almanac | “Those who understand market history are bound to profit from it!”
Ned Davis Research @NDR_Research
36K Followers 520 Following Founded in 1980, NDR is a global provider of independent investment research insights, tools and solutions. Log in for latest posts and updates.
Liz Ann Sonders @LizAnnSonders
625K Followers 771 Following Chief Investment Strategist, Schwab Center for Financial Research. Disclosures: https://t.co/UPkjXThiIk
MockTrade @MockTrade
3K Followers 302 Following Stock Index Futures and Equity Options Strategist at Hamzei Analytics. #ES_F #SPY #IWM #CL_F http://t.co/QdqrkPkCXr http://t.co/vgEZM66mXw
Mark Hulbert @MktwHulbert
11K Followers 3 Following
Sam Stovall @StovallCFRA
10K Followers 174 Following U.S. Equity Strategist with @cfraresearch Equity Research and Fund business and author of The Seven Rules of Wall Street. Disclosures: https://t.co/RU7FMdVRy6
TomAspray @TomAspray
4K Followers 4K Following Tom Aspray, professional trader and analyst, is acknowledged as a pioneer in computer technical analysis.
Frank Zorrilla @ZorTrades
35K Followers 506 Following Frank Zorrilla | ZorTrades Swing Trading (0–5 days) Volume × Structure × Breadth I show the process daily 👇 Trade it with me
Jerry Parker @rjpjr12
31K Followers 668 Following Trend Following Plus Nothing Trend Following Alone Trend Following is EnoughYou might like