Flowers @FloweringPath
Joined January 2008-
Tweets4K
-
Followers342
-
Following1K
-
Likes150K
The media keeps referring to SpaceX as a $1.75 trillion IPO -- but they're actually selling only $75 billion of stock. $75 billion is still a lot of money for investors to come up with, but they're not going to have to raise $1.75 trillion somewhere...

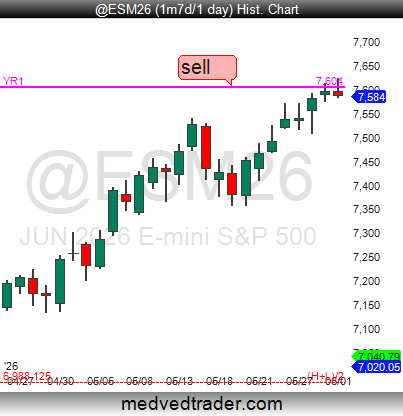
⚠️🚨My $ES_F $SPX $SPY charts are ALL flashing "WARNING" here at the Yearly R1 #pivotpoint(YR1)! ⚠️🚨 The BIGGEST reversals happen at the Yearly #pivotpoints! 😉


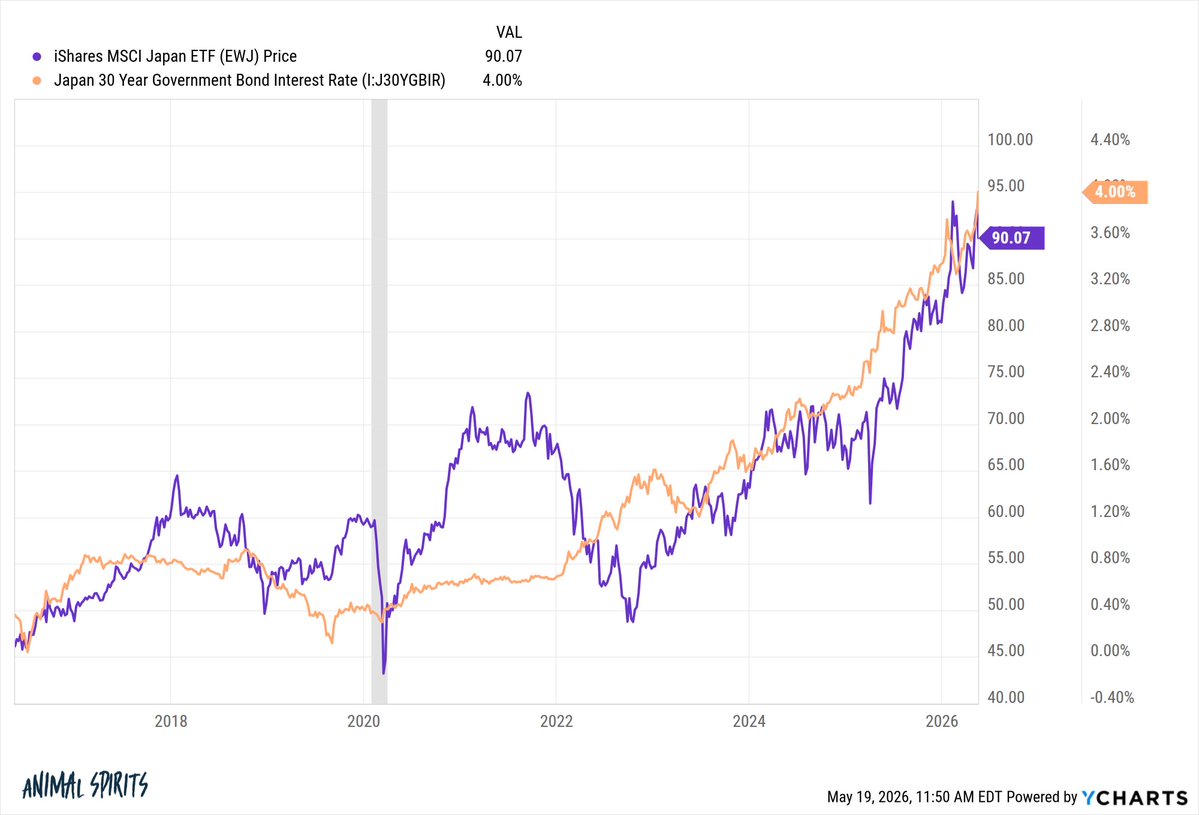
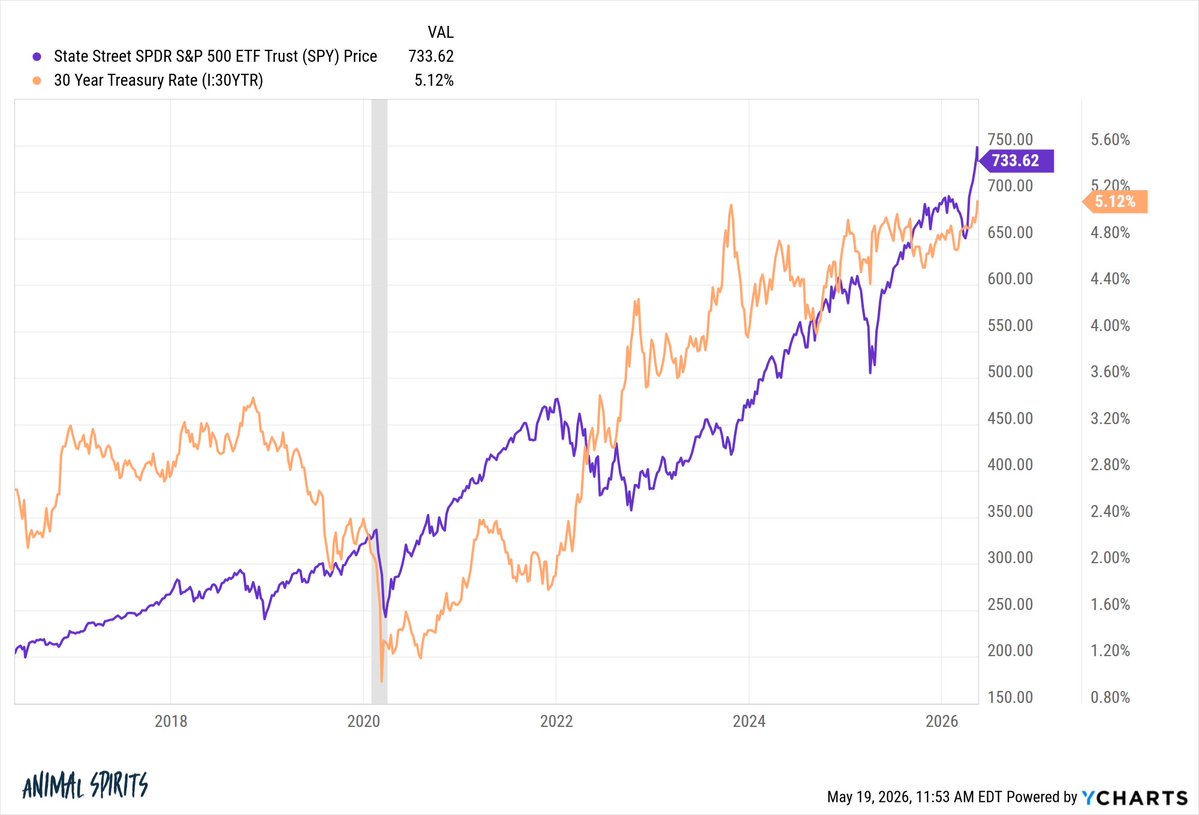
Everyone is freaking out about rising government bond yields...except for the stock market Rising yields on 30 year govt bonds and rising stock prices in both Japan and the US What if bond yields are just normalizing for a higher growth/inflation world?

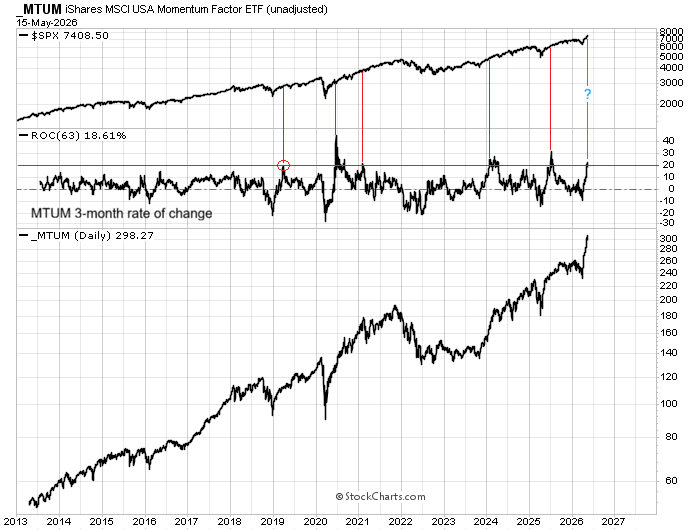
This is a great example of sideways thinking. Many chartists look for indicators that show a topping or bottoming condition. This is an indicator which REFUTES the premise of a topping condition. That can be a valuable thing.

Comment: SPX has demonstrated notable continuation following extreme momentum in momentum-factor stocks since MTUM was launched in 2013. Different this time?
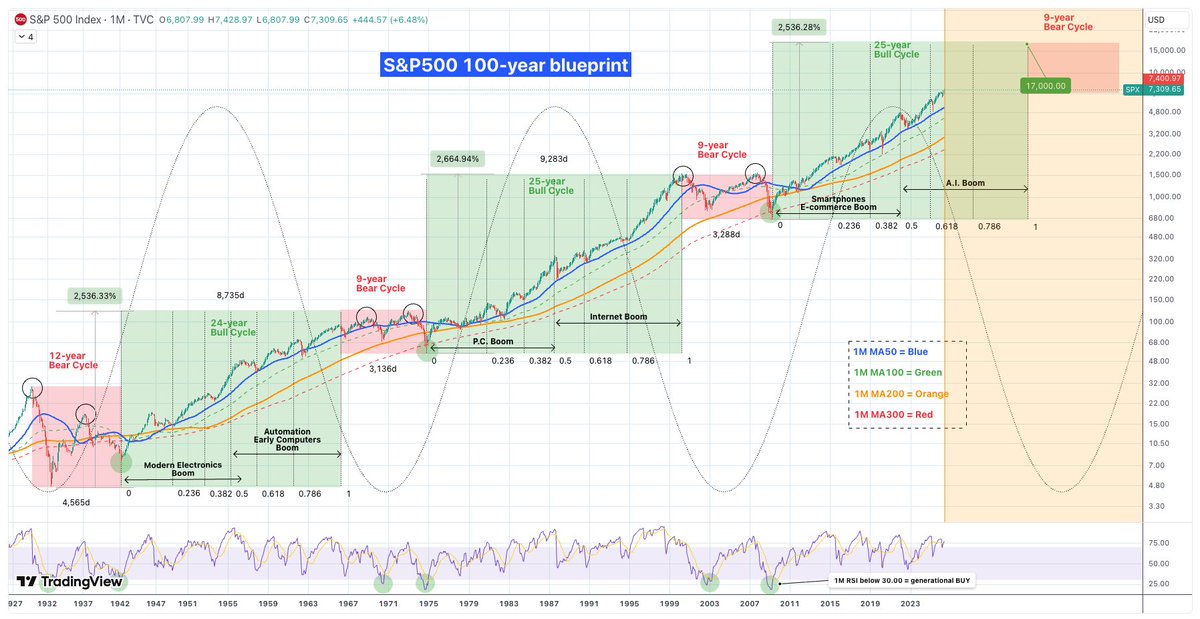
Der 100-Jahre-Plan für den Aktienmarkt Wenn du dir die letzten 100 Jahre anschaust, siehst du ein klares Muster: Der Markt wiederholt immer wieder die gleichen Zyklen. Seit der Großen Depression 1930 gab es drei große Abwärtsphasen und drei Aufwärtsphasen . Wir stecken gerade mitten im dritten großen Bullenmarkt. Die schlechten Zeiten (Bärenmärkte) Diese Phasen dauerten meistens etwa 9 Jahre (die Weltwirtschaftskrise von 1930 war mit 12 Jahren eine Ausnahme). Ein typisches Zeichen war, dass der Markt zweimal oben und zweimal unten „anklopfte“, bevor es wieder aufwärts ging. Oft krachte der Kurs bis zu einer bestimmten langfristigen Linie (dem 300er-Schnitt im Monatschart) und startete von dort aus neu durch. Die guten Zeiten (Bullenmärkte) Die ersten beiden großen Aufwärtsphasen dauerten jeweils 24 und 25 Jahre. Das Spannende: Sobald der Markt einmal Fahrt aufgenommen hatte, fiel er fast nie unter eine bestimmte grüne Linie (den 100er-Schnitt). Die blaue Linie (50er-Schnitt) war dabei immer die beste Chance, um günstig nachzukaufen, wenn es mal zwischendurch ruckelte. Warum steigt der Markt so extrem? Hinter jedem Bullenmarkt steckt eine neue Technologie: Früher waren es industrielle Durchbrüche. Dann kam der Internet-Boom. Heute erleben wir den E-Commerce- und Social-Media-Boom. Klar, irgendwann platzen diese Blasen immer, weil die Leute übertreiben. Aber die Technik bleibt! Das Internet ist nicht verschwunden, nur weil die Kurse im Jahr 2000 abgestürzt sind – es wurde zum Fundament für alles, was wir heute nutzen. Der KI-Boom Wir sind jetzt im zweiten Teil des aktuellen Aufschwungs, und der wird von der Künstlichen Intelligenz getrieben. Wahrscheinlich wird diese Blase um das Jahr 2034 platzen. Das wird wehtun, aber danach wird KI das feste Rückgrat unserer gesamten Wirtschaft sein. Im Grunde sind die letzten 100 Jahre eine Kette von Erfindungen, die die Kurse immer höher treiben. Die Abstürze zwischendurch sind nur dazu da, die heiße Luft rauszulassen und Platz für neues Geld und die nächste Technologie zu machen. Was bedeutet das für dich heute? Wenn dieser Zyklus so läuft wie die letzten beiden, könnte der S&P 500 bis auf 17.000 Punkte steigen. Es wird zwischendurch immer wieder Korrekturen geben. Der Zoll-Crash Anfang 2025 war so ein Moment, hat aber die wichtige blaue Linie nicht ganz berührt. Schau auf den RSI-Anzeiger. Wenn der unter 30 fällt, ist das eine Chance des Jahrzehnts. Das ist in 100 Jahren erst sechsmal passiert – und jedes Mal war es der perfekte Zeitpunkt zum Kaufen. Liken, Folgen, Speichern, Kommentieren, Teilen. Danke für den Support 🫶😊🫶
@al_xdpg Wow! I still haven’t managed to eat myself fully invested. I’ve done well, but making notes for next time. 😊
@mwebster1971 @IBD_JNielsen You’re the best!☝️😊
@mwebster1971 @IBD_JNielsen I seriously wouldn’t know where to begin. 😅
@mwebster1971 @IBD_JNielsen By the way, I don’t use MarketSurge because I haven’t seen that it is as good as thinkorswim on mobile. If MarketSurge ever gets really good on mobile, that would be great!
@mwebster1971 @IBD_JNielsen I hope someone else will see this and do a study. I would like to see a series of follow through days using volume compared to days that would qualify as follow through days, except the volume was too low, and the comparison of which of those turned into power trends.
@mwebster1971 @IBD_JNielsen I’m a big believer. I don’t let perfect. Be the enemy of good. And it is possible that applies to this situation. It is possible that it does not apply as well. Cheers. Thank you for your work and sharing your knowledge with us
@mwebster1971 @IBD_JNielsen I totally believe you that volume is faulty.I am not convinced that it is completely useless, though. Really, the only thing that would convince me that it was useless would be for someone to study enough instances that show that even the faulty data do not give a decent signal.
@mwebster1971 Whether it’s dirty volume or some kind of voodoo, a study will mean more to people than the why. Just contrast the volume shown to the actual results. If it works, it works if it doesn’t, it doesn’t. @IBD_JNielsen
@mwebster1971 I watch most of your YouTubes and follow you on IBD Live as well. I appreciate all of the knowledge you impart to us. I watched most of your volume series. I think you should consider doing a study on either a daily or a weekly basis using volume and showing outcomes.
@alphatrends @mwebster1971 Loved the interview! Brian, I’ve been watching your videos since I believe 2008. It was great hearing your story. I have only known your work, but not your story.
@alphatrends Love! The infographic! I like the visual because I am used to reading charts and this makes it faster for me to digest the information.

The S&P 500 triggered a rare technical event today, gapping above both its 50D and 200D moving averages simultaneously. This looked weird to me, so I did some digging. Since 1950, this specific signal has occurred only four times. In every instance, the index faced significant pullbacks shortly after. The average three month drawdown following the signal is -9.51%, with the worst three month drawdown reaching -12.92% during 2018. Historically this has always been an exhaustion gap rather than a sustainable rally. Maybe this time is different.


Lawal NFT @lawalmufutauoka
919 Followers 1K Following Crypto enthusiast navigating the digital frontier with SOL, NFTs, and all things blockchain! Living life one ETH, BTC, and BNB at a time. #CryptoLife #NFTCollec
Rachel Dashiell, CFP,... @RachelDashCsS
81 Followers 1K Following Trader. Runner. Hiker. Chart lover. Market technician. Education coach @SchwabTrading & Contributor @SchwabNetwork Imp Disclosures: https://t.co/nfE0gq6WKx
Alexa D @hottiealexah
3 Followers 327 Following i’m a lot to handle but luckily i come with an instruction manual (my best friend)
echiphay @eherrrrrrr
1 Followers 67 Following
oliver Lucy @oliverLucyyjy
68 Followers 2K Following honest, caring and I have a good heart. Looking forward for a good day

_Gert Wollmann @Gcrt_Wcellmann
18 Followers 954 Following Landesvorstand @fdphh -fdp-hamburg.de | Bezirksvorsitzender @fdpwandsbek -fdp-wandsbek.de
Alissa C0ram @AlissaC0ram
29 Followers 1K Following Executive Editor, Multimedia at Investor's Business Daily @IBDInvestors / @SMU finance & journalism alum / views are my own
Adam @NoeleWein
18 Followers 329 Following A stock market investor. I got tired of the 9-to-5 job, so I learned stock trading, which changed my life.

Jet Ski Bandit @fulovotboss
491 Followers 7K Following Chairman of Fulovot ~ jet ski maniac ~ stock investor ~ donut connoisseur ~ I'm apparently on a diet & often inappropriate ~ may start a clothing brand one day
Beyond The Trades @Beyond_TheTrade
32K Followers 4K Following 📈Go Beyond The Trades and view so much more trading, non trading & AI projects at https://t.co/Nkcf6Xvqxz


Kyren COMMENTARY @n0BS_crypto
173 Followers 2K Following Financial Freedom is a CHOICE 💸 No BS Crypto host Ex- 🔊Banker 🏦 l've Saved 150K investors from harmful crypto advice 📘
fabianeleonori052 Joh... @fabianeleo57741
0 Followers 193 Following Hi, I'm from Queens, New York. I'm currently single and enjoy exchanging valuable information with friends.
Za @girl19356
50 Followers 2K Following My trading and investing journal where I share charts, trade ideas, and market thoughts. Posts are not financial advice.
John Doss CFA, CPA @Yukich86284901
46 Followers 161 Following I co-manage a long only family office. I don’t like losing money. My tweets are not investment advice. You need to do your own work...I DO NOT HAVE A DISCORD!
Kyle Adams @cevlkfinance
197 Followers 7K Following 29 | Investing to $1,000,000 in my taxable brokerage | Crazy enough to jump out of planes for fun | not financial advice
Louis Sykes @sykesLouisez
196 Followers 5K Following Senior Crypto Analyst, All Star Charts | Exploring markets, psychology, and why people buy jpegs over stocks
Daniela @RYg8dyqJeEH8qn
25 Followers 834 Following
MarginSafe🇺🇸 @Puipou908
40 Followers 2K Following 15-30% Monthly | 2 High-Conviction Stocks.Short-Term Gains: 15-20% in Days/Weeks.DM "JOIN" for WhatsApp Alerts. Live Trade Signals • Market Analysis
SmallCapAlpha🇺🇸 @Awdearfvu09183
47 Followers 2K Following 15-30% Monthly | 2 High-Conviction Stocks.Short-Term Gains: 15-20% in Days/Weeks.DM "JOIN" for WhatsApp Alerts. Live Trade Signals • Market Analysis
Heather Hullatt @Cirresistible
278 Followers 7K Following
MergerArbPro🇺🇸 @Rhugee1824425
43 Followers 2K Following 15-30% Monthly | 2 High-Conviction Stocks.Short-Term Gains: 15-20% in Days/Weeks.DM "JOIN" for WhatsApp Alerts. Live Trade Signals • Market Analysis
Ataqo @Ataqo16169
47 Followers 3K Following
ML_Stocks🇺🇸 @Wudou920941
56 Followers 2K Following 15-30% Monthly | 2 High-Conviction Stocks.Short-Term Gains: 15-20% in Days/Weeks.DM "JOIN" for WhatsApp Alerts. Live Trade Signals • Market Analysis
Alayna Abbott @AAbbott23048
48 Followers 3K Following
テクノロジー株... @Alhererwi108
59 Followers 2K Following 【完全無料】 25年の株式投資プロチーム(運用資産500億円以上)が提供:毎日の市場分析レポート + 優良成長株のピックアップ。プロの情報を無料で。まずはお気軽にお問い合わせください。
Alexandra @Mauidaw060
13 Followers 2K Following
EleniQuattro @Uirhiefo3894
3 Followers 92 Following Aim for steady growth, patiently wait for exceptional returns. — Benjamin Graham https://t.co/Vs50eKNiGX
Kang @thunkang
155 Followers 7K Following Full time options trader & Army vet. 100 for setups & #options flow @ #BlackBoxStocks. Save 20% off your 1st month https://t.co/AFya7dsYBm
Dividend Diplomats @DvdndDiplomatis
71 Followers 3K Following Two 30 something dudes who are blogging about #Investing, #Frugality, Passive Income & attempting to Reinvest Our Dividends to Financial Freedom!
Yyuriy Matsso @Yyurriymat
103 Followers 4K Following Futures algo trader. I develop and run algorithmic strategies and automate them in TradeStation. Their results:https://t.co/f5MasTRP3X
Donna @Donnakwheeler00
1K Followers 3K Following Jeremiah 29:11 ~ For I know the plans I have for you, declares the Lord, plans for welfare and not for evil, to give you a future and a hope.

Mark - My Words @MarkMyWordsXYZ
4K Followers 3K Following God First | Connoisseur of Coffee | Zero Filter | Debate w/ Caution | America First 🇺🇸
Toysessm @ToysessmQW11fh
15 Followers 625 Following
Dr. Eric Wish @WishingiWealth
105 Followers 2K Following I am a research psychologist and also Sir SilentKnight (from Worden/TC2000); teach technical analysis at local university; 50+ yrs experience trading
Katy McCay @McKt
320 Followers 392 Following Loves Jesus, @jasonmccay, my 5 babies, coffee and chocolate. Living in Alabama, right where I grew up while a piece of my heart is in California.
Jay Kaeppel @jaykaeppelp
69 Followers 149 Following Jay is Senior Market Analyst at https://t.co/qOs5v0Elgb and author of Seasonal Stock Market Trends (Wiley). Trader, writer, instructor and former CTA.
Tony Denaro @Tony_Denarou
144 Followers 5K Following YouTuber, Entrepreneur, Advocate of fair & transparent markets. All opinions are my own - No One Pays Me. Understand the Financial Statements before investing.
chris Moss @chris1_moss22
195 Followers 7K Following Multifamily Investor | Catholic, Texan, Bullish.
Jordan Roy-Byrne CMT,... @TheDailyGoId1
215 Followers 3K Following Chartered Market Technician & Master of Financial Technical Analysis. Married to my best friend, the best wife I will never solicit you via DM. Beware of fraud
Sam Wouters @Sdwouterr
39 Followers 1K Following Heading up Marketing & Content at @River Pronounced Wow-ters

Margot Paez @jyn___urso
18 Followers 387 Following Climate change physicist and admirer of heterodox economics. I have crazy ideas about bitcoin. Tweets are my own, not my employer's. Climatepunks use bitcoin.
Yuriy Matso @yuriumatsoo
202 Followers 6K Following Are you a futures day trader? Leverage a profitable long-short algorithmic strategy. Result here: https://t.co/yKIgFpNgKv
Dennis C @ddennisc230
224 Followers 2K Following Learning the ways of the monkey @tickermonkey Focused on growth stocks that have a new factor. Love to travel and anything outdoors. Sharing a few photos too
JackTheRippler @JackHmeislersf
96 Followers 2K Following x CRYPTO NEWS IN REAL TIME | SELFMADE I Developer & Co-Creator of @rplsripples |*DYOR & NFA*
Rachel Dashiell, CFP,... @RachelDashCS
4K Followers 179 Following Trader. Runner. Hiker. Chart lover. Market technician. Education coach @SchwabTrading & Contributor @SchwabNetwork Imp Disclosures: https://t.co/wYzhxp2xt6
Jonny Matthews | Supe... @super_macro
26K Followers 2K Following Daily macro note for serious investors. Ex-Brevan Howard PM (12 yrs). Rates, FX, equities — what the data means and how to trade it. ↓ Free 30-day trial

Leopold Stock Tracker @LeopoldATracker
72K Followers 4 Following @leopoldasch portfolio tracker. An industry leading commentary on AI infrastructure. Follow for early stock alerts and market insights.
Don Vandenbord @dvandenbord
7K Followers 3K Following Partner, CIO & Senior Portfolio Manager at Revere Asset Mgmt. Creator of the trend-following GROTECTION & ROBOTECTION investment strategies.
Mike Zaccardi, CFA, C... @MikeZaccardi
74K Followers 93 Following Financial writer. Markets & charts. Subscribe for exclusive charts, direct engagement, and a follow-back. Open to freelance or full-time work.
Damon Pavlatos @DamonPavlatos
29K Followers 84 Following Futures trader | 47 yrs in markets | Former CME member | Principal Partner @ FuturePath Trading® | Live market analysis https://t.co/Blo8nbvXsO
Überrenditen @Uberrenditen
10K Followers 337 Following Ein Value Investor auf der Jagd nach Überrenditen. Bullisch auf Aktien, Bitcoin und Sammelkarten. 36 | IT-Manager | Keine Anlageberatung.
Ted Zhang @TedHZhang
67K Followers 684 Following Portfolio Manager of Turbotection® building @RevereAsset Management. Client/Business inquiries: [email protected]. Partnered with @Deepvue @TraderLion.
Revere Asset Manageme... @RevereAsset
6K Followers 23 Following SEC-Registered RIA. Transparent, fee-only fiduciary. GROW assets during uptrends, PROTECT during downtrends. It’s what you KEEP that matters.
The Stock Up @TheStockUp_
2K Followers 425 Following Helping everyday investors build generational wealth 📈 https://t.co/6BZQqLXVN6
Peter Grandich @PeterGrandich
23K Followers 110 Following Part of a financial planning group in Wall, NJ, blogger and podcaster https://t.co/83329J2UYi https://t.co/gW5R0QBFvV
Antonio Costa @ACInvestorBlog
218K Followers 572 Following 52yo Private Trader | +25y experience in US Stocks. Always DYOR - Tweets are my personal opinion, not advice.
Dan Marchese @DChartLife
4K Followers 632 Following Analyst @allstarcharts | Charts/Markets/Stocks/Trends | Views are my own
George Tkaczuk @jurijt
4K Followers 1K Following George Tkaczuk, MD, MPH, Portfolio Manager at RCM Wealth Advisors. Libertarian, Winner 2020 US Investing Championships MMVR $1million+ accounts returned 119.1%
Rob Anderson @_rob_anderson
8K Followers 231 Following U.S. Sector Strategist @NDR_Research | @Mizzou
Rebecca Fernandez @Rebecca98869736
2K Followers 1K Following #Beta 1.16 #Sharpe Ratio 1.17 #Sortino Ratio 3.52 #Jensen’s Alpha 74.06 #Omega Ratio 2.55 #Treynor Ratio 4.99 #Information Ratio 1.02 #Calmar Ratio 3.01
SmartReversals📈 @SmartReversals
23K Followers 536 Following Subscribe to my website and join 28K+ traders to receive 3 premium publications per week analyzing $SPX, U.S indices, ETFs, magnificent 7, crypto, and megacaps.
John Muchow, MSCS @JohnMuchow
54K Followers 2K Following Full-time growth stock/options trader. Creator of TrendPro suite, top-rated @TradingView indicators based on years of collaboration with top performers in USIC.
Ricardo Sarraf @nullcharts
8K Followers 350 Following intermarket / cycles / trends all opinions are my own, not investment advice, etc.
JaviCharts 🤘 @ChartsJavi
44K Followers 354 Following Engineer who uses technical analysis to swing trade stock and options.
Eve Boboch @EBoboch
11K Followers 3K Following Portfolio Manager and Market Strategist, Co-Author of The Lifecycle Trade. https://t.co/Lq227h4v7v
Ines Ferre @ines_ferre
6K Followers 858 Following Senior business reporter @YahooFinance. 🔔 Bilingual. Born in Buenos Aires. 🌎
Lindsey Bell @justLBell
14K Followers 2K Following NYC heart, Pittsburgh genes, Cali dreams. Stock market student, cheerleader of people.
Julia Cordova✨ @CordovaTrades
127K Followers 4K Following Trader. NOT financial advice. If you make too much money, please discontinue use of my charts. $ES, $SPX, $SPY, $NQ, $RTY, $GC, $SI, $GDX, $CL, $NG, $MSOS
Michele 'Mish' Schnei... @marketminute
29K Followers 558 Following Chief Strategist MarketGauge Fin Pub, partner MGAMLLC RIA, Author Plant Your Money Tree-Former NY Commodities Exch member/Media expert/Creator Eco Mod Fam
Raghee Horner @RagheeHorner
27K Followers 35 Following I believe The Matrix is a documentary. Coffee is the fifth food group. And trading is really self discovery disguised as a candlestick chart.
Jessica Ablamsky @jablamsky
21K Followers 897 Following Freelance marketing writer, journalist, and stock market junkie. I ♥️ tech and consumer discretionary.
Kim Ann Curtin, The W... @kimanncurtin
10K Followers 6K Following Trading Coach Author: Transforming Wall Street Host: The Wall Street Coach Podcast Free mindset tools 👉 https://t.co/lIuW5bV7eC
Rosanna Prestia, MBA @RosannaInvests
29K Followers 793 Following Investment Advisor & Strategist. 5x Founder/CEO @hydrawealth @hydracapitalgrp. Host @theroshowpod. Finding asymmetric opportunities before they’re consensus.
Anne-Marie Baiynd, Tr... @AnneMarieTrades
40K Followers 2K Following Believer✝️ Grounded, Grateful. Futures & Options Trading https://t.co/rFsGr1zQAH
Denise K Shull @DeniseKShull
24K Followers 5K Following Consult on psychology of decisions. Leverage neuorscience + psychoanalysis. Hedge funds/PE hire me to help PMs make more $ via improved risk predictions.
Adara LePage @tradertvadaral
450 Followers 25 Following TraderTV Live Host // I share news and infographics at TTVResearch on X! Not financial advice, just charts and thoughts! *new account*
Linda Raschke @LindaRaschke
134K Followers 127 Following Private Trader, lifelong student of markets, retired top performing hedge fund manager, featured in New Market Wizards
Kyna Kosling @KynaKosling
13K Followers 79 Following Trading writer. I dissect how top performers think on my free Substack & ghostwrite for traders. TTRH: https://t.co/G4C5eEvTfK. NFA.
Francesco @FranVezz
21K Followers 286 Following Swing trader focused on risk FIRST. For trade ideas, market analysis, nightly video & lots more, check out my 5x weekly newsletter. Also lead a Discord room.
Sawyer Merritt @SawyerMerritt
1.1M Followers 465 Following EVs/space/tech. Bringing you the latest news in a single, easy-to-read feed. $TSLA & $SPCX investor, Model Y owner.
Terry Steffen @steff147
572 Followers 398 Following Statistics geek, retired from career in finance. Former Visicalc and Lotus 1-2-3 user. Blessed to be a grandpa. Tweets are not investment advice.
JK @jonbking
18K Followers 4K Following Trading | Macro | Alts & ETFs | Crypto & Tech | @chartwizardsNFT | Views are my MINE | English & 中文
Connor Bates @ConnorJBates_
53K Followers 800 Following Portfolio Manager of TURBOTECTION at @RevereAsset Management. Business inquiries ~ [email protected]
Duality Research @DualityResearch
9K Followers 177 Following
Ed Bradford @Fullcarry
54K Followers 453 Following US government bond trader since '93 with the usual stints along the way at primary dealers and HFs. Now on my own. Pseudonym
Nick Schmidt @NickSchmidt
163K Followers 408 Following Stock tweeter. Big weekly chart guy. Always learning.
Marios Stamatoudis @stamatoudism
32K Followers 345 Following Sharing ideas, charts, and the philosophy behind trading | 2023 US Investing Championship - Top Performer +290% | Official Profile - Blue Check
Jeff Sun, CFTe @jfsrev
49K Followers 199 Following 16 years of stop losses, pain & grit to $ 10M multi-asset. My 17-Chapter Trader’s Guide - https://t.co/0F5tgGM49z
iain @ohiain
42K Followers 172 Following Personal Journal † Aggressive Momentum Swing Trader | Focused on Tension & Release | Sharing thoughts and ideas - NFA.
lauren emily @leamuirleyn
5K Followers 489 Following Wife to @keonne who is serving a 5 year federal prison sentence for writing code. Free Keonne. #pardonsamourai
The Inner Circle Trad... @epictrades1
52K Followers 5K Following Fund manager / Traders of US equity and options . Mentors with t3live Tweets are informational and not investment advice. https://t.co/hGIBzcWdJL
John Doss CFA, CPA @JohnDoss1
10K Followers 1K Following I co-manage a long only family office. I don’t like losing money. My tweets are not investment advice. You need to do your own work...I DO NOT HAVE A DISCORD!Trends for United States
You might like