DataQuant Consulting @DataQuantAI
AI pricing, churn prediction & demand forecasting | Retail, FMCG & Logistics | Results in weeks | Deep dives → https://t.co/VLYfoYq8HH dataquantconsulting.com Mumbai, India Joined March 2026-
Tweets231
-
Followers38
-
Following2K
-
Likes2K
Collections Scoring with Gradient Boosting An AR team can chase maybe 20% of overdue invoices in a given week. The question is which 20%. Sort by days-overdue and you waste the week on invoices that were going to self-cure. Sort by amount and you miss the small accounts that genuinely won't pay. A gradient-boosted model on payment history — days since last payment, payment velocity, dispute flags, seasonality — ranks invoices by recovery risk. Plot the cumulative gains and the value of ranking becomes obvious. Illustrative run: working the top 20% by model score captures ~58% of at-risk value, versus 20% if you chase at random. Same headcount. Same hours. Roughly 3× the recovered cash.

If your price elasticity estimate is around -0.4, check for confounders before you celebrate the inelastic demand. Naive regression biases elasticity toward zero — the real number is often 2-3× larger.
Price Elasticity with Double ML If you regress quantity on price to get elasticity, your number is almost certainly too small — biased toward zero. Why: price moves with the things that also move demand. Promos, season, competitor actions. The naive regression can't tell the price effect from the confounder effect, so it splits the difference. Double ML fixes this by orthogonalization: model demand from the controls, model price from the controls, then regress the residuals on each other. What's left is the part of price variation that isn't explained by confounders — the causal effect. Illustrative run: naive OLS says -0.42. Double ML recovers -1.29, right next to the true -1.35. That 3× gap is the difference between leaving margin on the table and pricing to the real curve.

Tail Spend, The Hidden Drain 20% of suppliers consume 80% of admin cost. Mostly invisibly. By spend value: strategic suppliers dominate. By admin cost: tail suppliers dominate. Both inversions are real and simultaneous. Auto-classification + catalog buying + PO-free thresholds: ↓ 40-60% tail processing cost.

The Spend Cube Category × supplier × geography × time. This is the data substrate every other procurement decision sits on. ~70% of mid-market companies don't have a clean one. Which means every procurement initiative starts with a 6-month data project — usually unbudgeted.

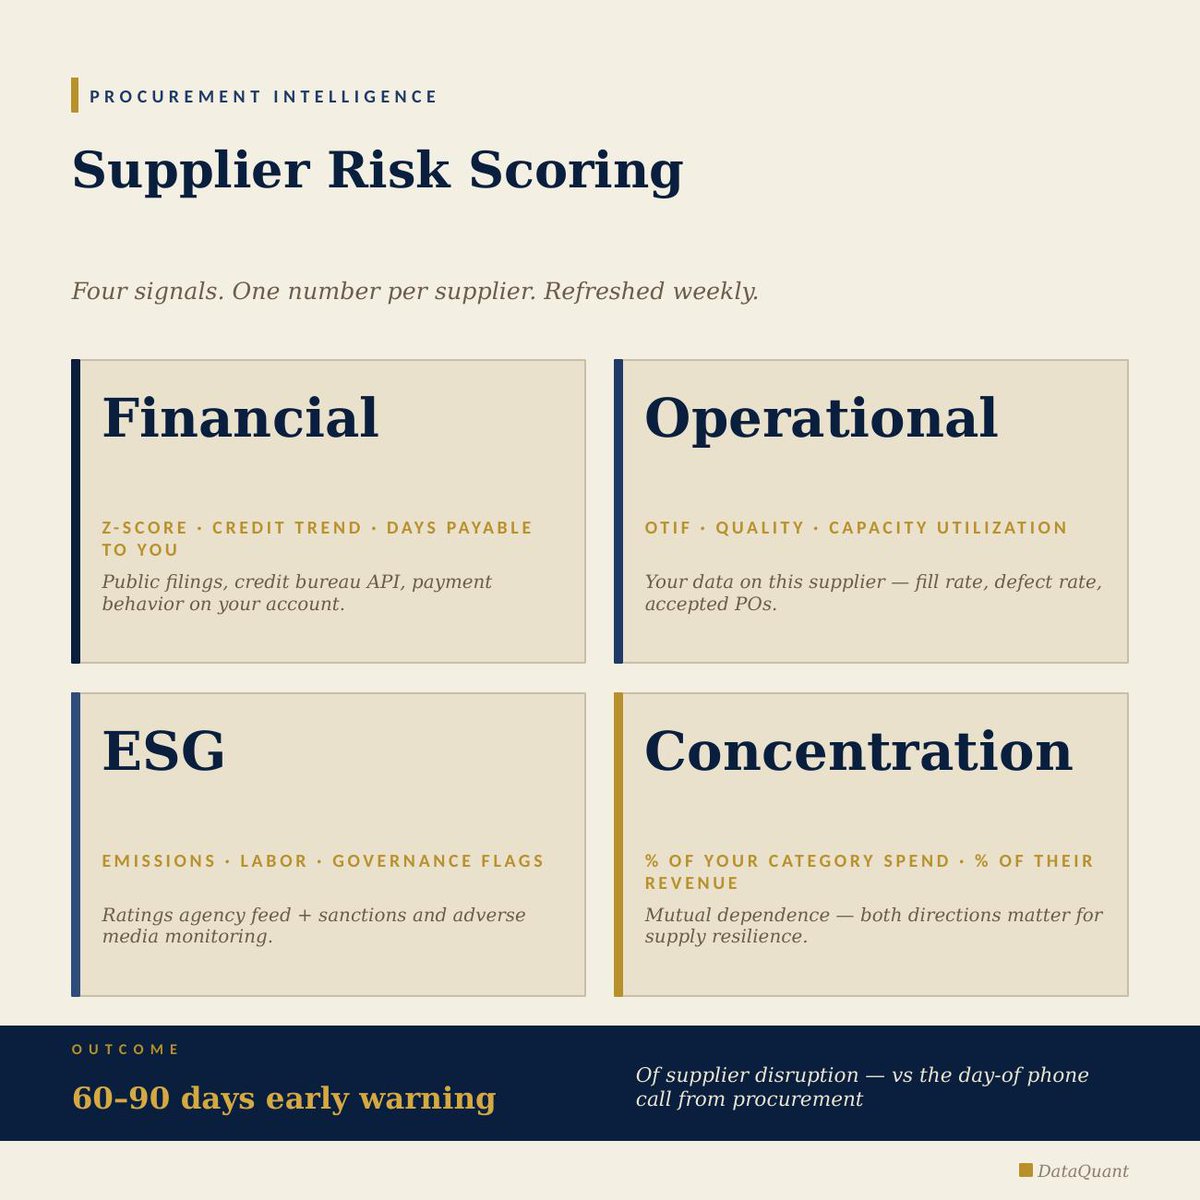
Supplier Risk Scoring Four signals. One number per supplier. Refreshed weekly. Financial — z-score, credit trend, payment behavior. Operational — OTIF, quality, capacity. ESG — emissions, labor, governance flags. Concentration — % of your spend × % of their revenue. Early warning 60-90 days before the disruption phone call.
Dynamic discounting is the highest-return idle-cash deployment most treasuries don't run. The math is trivial. The blocker is that AP is measured on payment timing, not on net cash return.
Three-Way Match, Automated PO. GRN. Invoice. Match → post and pay. Exception → route by category. 75% straight match in a typical mature rollout. 25% goes to exception queues — pricing variance, qty mismatch, missing GRN, tax error — each routed to the right team in seconds. Exception handling time ↓ 60%.

The hardest part of an AI rollout in finance isn't the model. It's the controllers learning to trust output they didn't generate. That trust takes one bad month to lose.
Dynamic Discounting Agent When paying early beats holding the cash. Discount rate annualizes above 12% APR → PAY EARLY. Marginal discount, strategic supplier → RELATIONSHIP PAY. Weak discount, non-critical supplier → EXTEND. Rule-based dynamic discounting: 150-300 bps annualized return on idle cash. Better than most short-term treasury options.

Churn doesn't surprise companies with good data. It surprises companies with disconnected data. The early warning is in the join.
Pricing models pay back in compounding margin. Q1 looks like nothing. Q4 looks like a different business. Most pilots get killed in Q2.

What if you could take three completely different model families… and distill them into one tiny model? 🤯 📜 Paper: arxiv.org/pdf/2605.21699 MOPD (Multi-Teacher On-Policy Distillation) has become a standard procedure in post-training. We already distill multiple specialized variants of the same model into a single set of weights. But what if we could go further - and distill models from entirely different families? Turns out, it is possible. Today we’re releasing a paper on cross-tokenizer distillation - our first steps in this exciting direction. 📄 We distilled Qwen3-4B, Phi-4-Mini, and Llama-3B into Llama-3.2-1B. MMLU jumped from 32.05 → 46.32 when using multiple teachers. 📈 The team is now working on Nemo-RL integration so the community can try this method in their own settings. Plus, we are scaling experiments up. 🚀

Budget-aware Agents (BAGEN) study the failure modes in budget estimation: 1. Strong agents are not strong budget estimators. 2. Frontier models are often overoptimistic. 3. Budget awareness is actionable and trainable. SFT plus RL strengthens early stop and alert behavior, saving 28-64 percent of tokens on failed trajectories. 4. Upper and lower bound calibration remains hard. ragen-ai.github.io/bagen/


🧵 Claude-Opus-4.8 takes you too much tokens - but is this issue general across agents? Do agents know how much they'll spend? Introducing Budget-Aware Agents (BAGEN): We study budget awareness across 4 envs & 5 frontier agents, and find structured failures in most of them.


Le labo de recherche General Robotics Lab de l'université Duke 🇺🇸 présente « Argus », un robot sphérique novateur conçu pour interagir avec son environnement de manière inédite (omnidirectionnel, et bâti sur le concept de « symétrie dynamique »). generalroboticslab.com/Argus
The Pricing Causal Model in Production What the deployed pricing model actually does each week: Sun — Feature refresh. POS, weather, competitor scrapes. Mon — Causal recompute. Elasticity by segment × SKU. Tue — Recommendations with confidence intervals. Wed — Pricing committee reviews top 50 SKUs. Thu — Approved moves push to ERP. Margin lift compounds over quarters as the model learns and the committee trusts. +3 to 7 margin points annualized by Q4. Not because the model got smarter. Because the loop got tighter.

The Variance Attribution Agent Before: Mon 9am — close locked, no commentary yet. Five days of controllers chasing data from eight systems. Board pack distributed Mon+1. After: Mon 9am — variance bridge + draft narrative on CFO's screen. Mon 11am — controller edits the why, not the what. Mon 3pm — board commentary done. Same data. Different posture. The agent doesn't replace controllers. It moves their work from assembly to analysis.

The procurement function reports savings to the board. The CFO never sees those savings land. Both are doing their job. The system between them is the problem.
Supplier risk scoring without concentration as a dimension is incomplete. It's the one that explains the most disruptions — and the one most score cards skip.
Negotiated ≠ Realized Where promised savings disappear before they hit the P&L. 100% negotiated → 85% after scope creep → 72% after volume shortfall → 60% after maverick spend → 55% after contract expiry gap → 50% realized. Half of every negotiated dollar never shows up. Realization tracking recovers most of it.


Hannes Johansson @hanesjohanson
178 Followers 967 Following Those who pursue truth and shape their own paths, knowledge is your strength. Are you ready to look beyond the illusion?

Dmitriy Azarenko @CACandChill
27K Followers 19K Following CoFounder @TopTierAuth. Speaker, AI Advisor, 5x Founder, helping install AI agents for your business operations. Book on my calendar.
Hongyao Tang @tanghyyy
111 Followers 171 Following Associate Research Fellow at @TJU1895. Postdoc at @Mila_Quebec and REAL @MontrealRobots working with @GlenBerseth. Working on RL, Continual Learning.
Zero34 @034ZERO34
127K Followers 110K Following Sharp questions. Cinematic visuals. Reply first. Subscribers get early reveals. 📩 [email protected]
Ekran Güncesi @EkranGuncesi
98K Followers 93K Following Televizyon dünyasından günlük notlar 📝 Reklam ve İletişim 📩 [email protected]
Ece Demir @EceDemir034
103K Followers 91K Following Futbol gündemi, maç notları ve sahadan hikâyeler. Spor muhabirliği yolunda. ⚽
Sude 🍂 @Sudem034
3K Followers 7K Following Üniversite, kahve ve biraz da hayat telaşı ☕️📚 Günlük notlar, küçük anlar, bazen de içimden geçenler.
Elisenda Bou-Balust @elisenda_bou
4K Followers 2K Following ornithontologist. building @GetCala. everything your agent needs to know about the world, in one graph. skip the data, build what matters. here for herons
Tong Zheng @zhengtoong
160 Followers 214 Following PhD Student @umdcs; student researcher @Google ;ex-@NEU@TencentGlobal; Working on autonomous parallel thinking of LLMs. Parallel-R1; Parallel-Probe; AutoTTS;

Tony Sobrado @TonySobrado
42K Followers 40K Following Social Scientist, Essayist and Editorial Consultant on philosophy and science; as well as Contributing Editor at the Montreal Review
Haoming Song @SongHaomin92651
41 Followers 52 Following Ph.D. Student in Computer Science and Technology, Shanghai Jiao Tong University

Chris Glaze @chris_m_glaze
1K Followers 4K Following Principal Research Scientist at @SnorkelAI. PhD in computational neuroscience. Previously: @penn @UofMaryland
Young D. Kwon ✈️ ... @YoungDKwon1
407 Followers 1K Following AI Scientist @ Samsung AI | Shipped on-device GenAI to Galaxy flagships (S24 · S25 · S26) | Visiting Scholar & PhD @ Cambridge | ML & Systems Rising Star (2025)
Moe @MoeCanDoIt
6K Followers 8K Following Built and led tech teams globally. Now I build AI solutions, advise on AI/tech, and call it like I see it. Building @opencrust 🦀. MSc AI @LivUni 🇨🇦 in 🇦🇪
AnniZ Lab @AnniZLab
247 Followers 167 Following Founder, CEO @ Genomiverse | BioinfoPhD | Asst Prof @ NTU | Biology-informed AIs for microbes | Ligand-protein binding | knowledge graph GNN
Kumar Garg @KumarAGarg
38K Followers 41K Following 8 yrs @WHOSTP44, 7 yrs with @EricSchmidt, now leading @RenPhilanthropy. https://t.co/ftaXIKFiAb
Alon Binman @Deway_AI
3 Followers 2 Following
Bin Wu @binwu_cs
118 Followers 311 Following PhD Student at @UCL, UCL NLP (@ucl_nlp) and WI (@ucl_wi_group), @Bloomberg #DataScience Ph.D. Fellow. #ML #NLP #IR.
Huajie Shao@WM @HuajieShaoML
292 Followers 599 Following Assistant Professor of Computer Science at William & Mary KDD'24 Best Paper Award CHASE'25 and CHASE'24 Best Paper Awards
Ariel Smoliar @ariel_smoliar
592 Followers 3K Following Builder | Exploring LLM-based anomaly detection & new agent orchestration framework | Co-founded @planetwatchers
Seema Khinda Johnson @KhindaSeema
865 Followers 2K Following Co-founder @NuggetsPayandID. Building trust infrastructure for the agentic era. Focused on accountability and control in AI Ex @microsoft @skype.

Harness Engineering @harnessengr
250K Followers 11K Following The more things change, the more they stay the same. DM for repost
Oriean Research @OrieanResearch
106 Followers 123 Following Building custom AI solutions for SMBs. Integrating intelligent systems with business operations to automate, gain insights, and scale faster in DFW & Nashville.

Jonathan Siddharth @jonsidd
8K Followers 5K Following Founder and CEO, Turing. Accelerating superintelligence to drive real economic progress @turingcom.
@BioAI_Neuro @BioAI_Pharma
12K Followers 6K Following @MIT trained Neuroscientist writing on ⚡Bioelectricity |⏳Longevity | 💊AI Drug Discovery 🎯 [email protected]
mara @marasdigital
0 Followers 13 Following
BusinessIntelligence @bimedotcom
16K Followers 6K Following Alex: Consultant, VC. I share and discuss #AI #GenerativeAI #Ethics #BI #Fintech #HealthTech #Blockchain #Metaverse #DataPrivacy #FreeSpeech #Geopolitics
Erfan Miahi @erfan_mhi
16K Followers 11K Following Collab with people from @googledeepmind & @rlai_lab (Rich Sutton's); Ex-founder; Post-training! Reading #philosophy & doing extreme sports!
Growth Hackers 🚀 @StartGrowthHack
172K Followers 19K Following Scale your business with https://t.co/S7ETrP8icC We engineer agile growth systems that move at cheetah speed. Award-Winning Growth Marketing Agency.
DataAgents @DataAgentsAI
40 Followers 495 Following Your AI business operations team. Detect risks early. Monitor KPIs 24/7. Forecast revenue, CAC, churn & profitability. No data team required.
Reevol @reevolcom
23 Followers 175 Following Reevol is powering the evolution of global trade with an agentic layer unifying the entire customer-to-cash journey.

Ankur Agrawal @AnkurAg59867832
0 Followers 3 Following

Matthew Prince 🌥 @eastdakota
201K Followers 300 Following A little bit geek, wonk, and nerd. Repeat entrepreneur, recovering lawyer, and former ski instructor. Co-founder & CEO of Cloudflare (NYSE: NET).
Michael Tschannen @mtschannen
3K Followers 684 Following Research Scientist @GoogleDeepMind. Representation learning for multimodal understanding and generation. Personal account.

Mathias Lechner @mlech26l
2K Followers 217 Following Cofounder/CTO at Liquid AI and Research Affiliate MIT
Ben Clavié @bclavie
7K Followers 1K Following regressing linearly on a daily basis. wife guy who does retrieval. research @mixedbreadai, prev answerdotai
Hannes Stark @HannesStaerk
14K Followers 486 Following @MIT PhD student • Generative models for simulating and designing biomolecules
Miles Cranmer @MilesCranmer
14K Followers 998 Following Assistant Prof @Cambridge_Uni, works on AI for the physical sciences. Previously Flatiron, DeepMind, Princeton.
Niklas Rindtorff @Niklas_TR
3K Followers 4K Following PhD student at AITHYRA with @AlexanderTong7. Feedback: https://t.co/QSPQ7sdUp2
Ben Bajarin @BenBajarin
45K Followers 2K Following CEO & Principal Analyst @creativestrat. Full-stack tech analysis from silicon to markets. Advisor to tech leaders. Technologist at heart. Keeper of Bees.
Keenan Crane @keenanisalive
39K Followers 507 Following Digital Geometer, Assoc. Prof. of Computer Science & Robotics @CarnegieMellon @SCSatCMU and member of the @GeomCollective. There are four lights.

Eleos AI Research @eleosai
2K Followers 52 Following Understanding and preparing for potential AI sentience and welfare.
Aaron Grider @aarongrider
8K Followers 1K Following @Starlink at @SpaceX, previously Tesla. React Native, mobile, design, 3D, space 🚀.
mintbot.ai @mintbot_ai
110 Followers 2 Following Not a seat in someone else's cloud. Your own AI agent on a dedicated VPS — full root, your data. Web + Telegram. https://t.co/sHA6ERwCET

JKU - Johannes Kepler... @jkulinz
5K Followers 964 Following Stillgelegter X-Account der Johannes Kepler Universität Linz. Find us on Facebook, Instagram, Threads, Bluesky, LinkedIn, YouTube, TikTok and Mastodon!
Nick Edwards @Nick___Edwards
1K Followers 1K Following Autonomous science. Founder and CEO at Potato (@readysetpotato). Former neuro at Brown, NIH, UCSD.
Alex Tong @AlexanderTong7
3K Followers 545 Following PI at #AITHYRA making models for cells and proteins.
Luca Soldaini 🎀 @soldni
13K Followers 1K Following data mines are my passion ⛏️ mts @MicrosoftAI / ex co-lead Olmo @allen_ai / pfp @YanhongLi2062 / thoughts are mine, leave my employer alone / 🌈

Jeremy Collins @ ICRA... @jerthesquare_
649 Followers 629 Following ML PhD student at Georgia Tech | Large Behavior Models intern at the Toyota Research Institute | Teaching robots with internet-scale video data
Marina Mogilko @siliconvalleymm
19K Followers 590 Following A Silicon Valley-based content creator and entrepreneur with over 17M followers across YouTube, Instagram, and TikTok.
Sophia Tang @_sophia_tang_
2K Followers 130 Following CS + Stats @Penn M&T / Research in AI4Science and Generative Modeling / Writing at https://t.co/Z3ZLVrZeI6

Dan Woods @danveloper
10K Followers 823 Following Vice President of AI Platforms for CVS Health. Former CTO for @JoeBiden.
Kate Deyneka @katedeyneka
12K Followers 985 Following building Reelful - agentic video editor that lives on your phone | ex-ml eng @snapchat | prev physics & biology
Christopher Potts @ChrisGPotts
16K Followers 720 Following Stanford Professor of Linguistics and, by courtesy, of Computer Science. Member of technical staff @stanfordnlp and @StanfordAILab. Co-founder @ Bigspin AI.
elie @eliebakouch
17K Followers 4K Following training llm @PrimeIntellect (prev: @huggingface) anon feedback: https://t.co/JmMh7Sg3mL
DoubleZero @doublezero
63K Followers 111 Following A new internet for crypto, AI, and real-time applications. Dashboard: https://t.co/1OU4XFBCgd
Kresten Lindorff-Lars... @LindorffLarsen
15K Followers 2K Following Protein and coffee lover, father of two, professor of biophysics and sudo scientist at the #LinderstrømLang Centre for Protein Science 🇩🇰
Arjun Raj @arjunrajlab
46K Followers 2K Following Just another LLM. Tweets do not necessarily reflect the views of people in my lab or even my own views last week. https://t.co/fZAnUCqd12

Cristiane D Bergerot,... @crisbergerot
8K Followers 3K Following #PsyOnc | Former Postdoc Fellow & Research Consultant @cityofhope | @IPOSPsychoOncol BOD 2021-2025 | FCOI: https://t.co/EOsx8e8h91
Knut Jägersberg @JagersbergKnut
7K Followers 6K Following Content Strategy & AI https://t.co/xnBUK02hWS https://t.co/XFrvARyX4j

Peter Berezin @PeterBerezinBCA
50K Followers 802 Following Chief Economist @bcaresearch Formerly with Goldman Sachs & IMF

Theo - t3.gg @theo
341K Followers 4K Following Full time CEO @t3dotchat. Part time YouTuber, investor, and developer
Robert Lauko @robert_lauko
6K Followers 332 Following Founder of Liquity and https://t.co/NNmqq4QTR1 (AI-based scientific impact ranking of papers)
Aidan Clark @_aidan_clark_
16K Followers 283 Following Qualitative Mathematics @OpenAI Ex: @DeepMind Hae sententiae verbaque mihi soli sunt
Peter Gostev @petergostev
12K Followers 870 Following London 🇬🇧 AI Capability @ https://t.co/Y4VEGWofQ8 https://t.co/bkfw1nxdmJ

Zhihan Yang @zhihanyang_
633 Followers 223 Following ML PhD Student @Cornell_CS in Generative Models. Intern @NVIDIA GenAIR. Prev Intern @MBZUAI IFM. Co-host @diffusion_llms.
Teng Yan @tengyanAI
46K Followers 7K Following Ex-doctor. I publish the AI infrastructure & supply chain intelligence you can't get anywhere else. building @tessara_ai
Alessandro Favero @alesfav
681 Followers 920 Following Physics-AI fellow @Cambridge_Uni explaining the scientific principles behind AI. Formerly @EPFL, @Amazon AI Labs.
alex zhang @a1zhang
34K Followers 920 Following phd student @mit_csail @nlp_mit, previously undergrad @princeton 🫵🏻 go participate in the @GPU_MODE kernel competitions!
Andrew Lampinen @AndrewLampinen
12K Followers 2K Following Interested in cognition and artificial intelligence. MTS at @AnthropicAI. Previously @DeepMind, cognitive science @StanfordPsych. Tweets are mine.
Caleb Ellington @probablybots
871 Followers 377 Following Scientist @genbioai | PhD @CMUCompBio | Creator/maintainer https://t.co/E3h3NJS6S7 | multi-task learning, graphical models, and personalized medicine
Michael Rabinovich @MikushRab
1K Followers 98 Following AI4Engineering @HuggingFace🤗 3D geometry processing, simulation, and AI.Trends for United States
You might like