Curis_Data @CurisData
We specialize in sourcing, processing, and modeling complex healthcare demand datasets into straight-forward and useful information. curisdata.com Fort Worth, TX Joined May 2024-
Tweets23
-
Followers5
-
Following31
-
Likes0
Urology momentum, mapped ⚙️🧪 An equal‑weight index (current visit volume + 5‑yr growth) highlights where urology capacity scales fastest. Leaders: Texas, Florida, California. Breakouts: Utah, Idaho. Use the map + split‑bar ranks to target markets, right‑size rooms, and tighten referral routes. CurisData → from demand signals to site decisions. #Urology #MensHealth #KidneyCare #PracticeGrowth #SiteSelection #HealthcareAnalytics


Chronic‑care engine: Internal Medicine is scaling 💊🧭 Signal: A composite index (0–1) that equally blends today’s IM visit load with 5‑year % growth. Impact: Flags markets primed for panel expansion, NP/PA staffing, and cardiology/endo adjacency, where complex care can scale. Leaders: Texas, Florida, California. Emerging: Utah, Idaho. Explore the map + split‑bar ranks to set clinic priorities, FTE plans, and ancillaries. CurisData → turning demand signals into site decisions. #InternalMedicine #PrimaryCare #ChronicCare #PracticeGrowth #SiteSelection #HealthcareAnalytics


Outpatient volume is set to jump 10.6 % over the next five years. If your next clinic is even one zipcode off, that’s millions lost. We blend real-time demand data and payer-mix projections so planners see exactly where demand—and ROI—line up before they break ground. Curious where your next site should be?
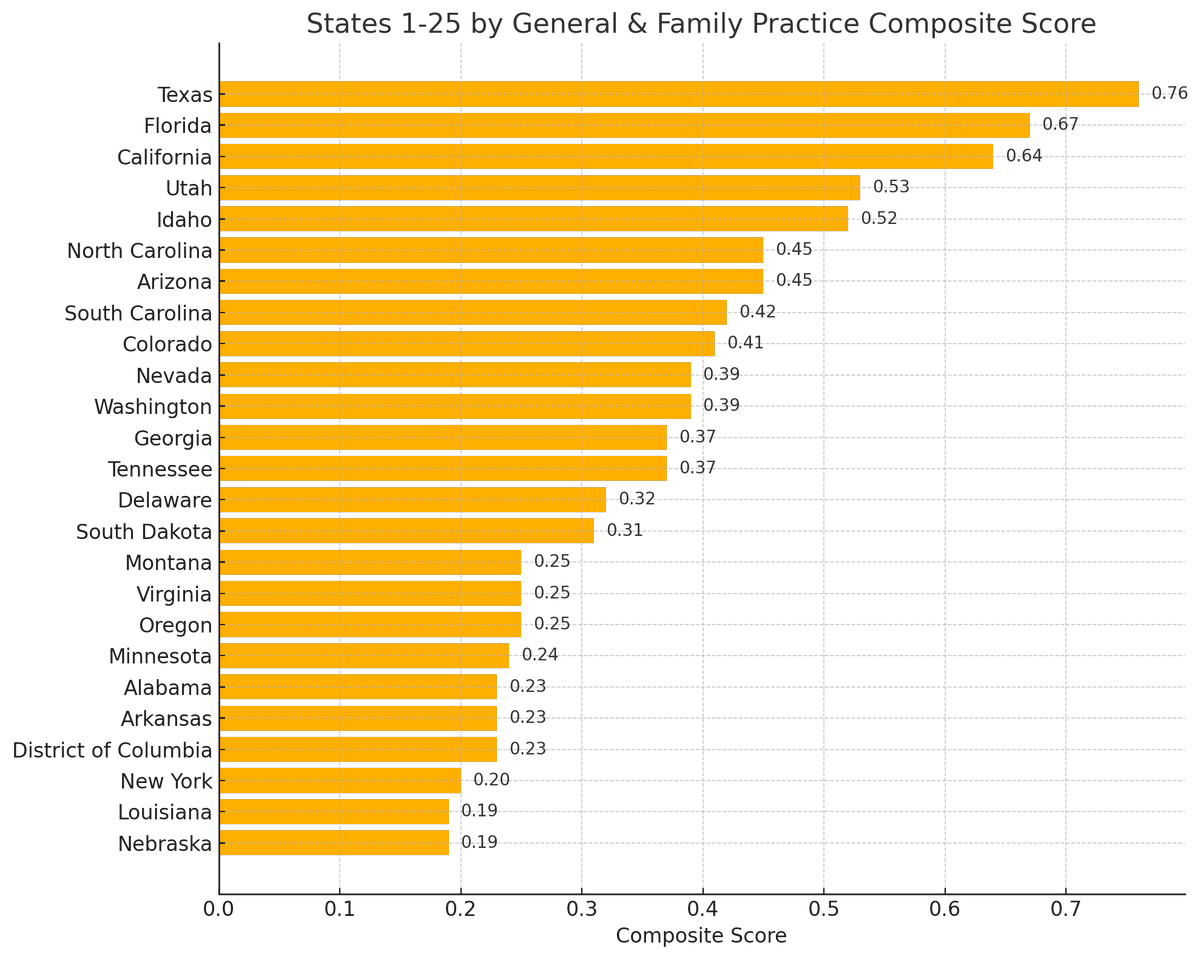
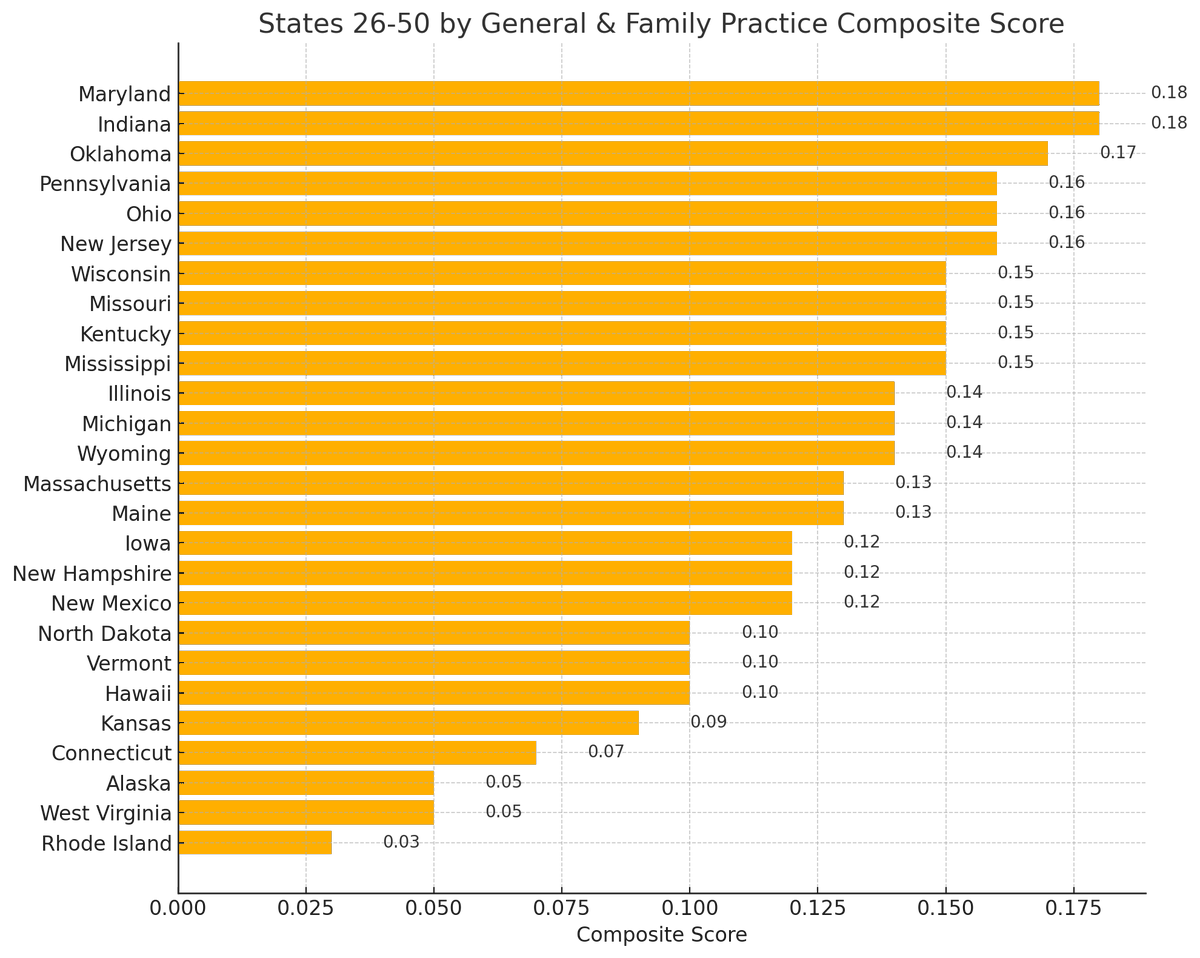
Family‑practice growth radar 🩺📊 Our composite score (0‑1) blends current visit volume with projected 5‑year % growth—an equal‑weight snapshot of both size and momentum. • Texas 0.76, Florida 0.67, and California 0.64 dominate the leaderboard. • Rising markets like Utah 0.53 & Idaho 0.52 are closing the gap fast. Locate your next primary‑care clinic. CurisData turns demand signals into smarter site picks. #HealthcareAnalytics #SiteSelection #PrimaryCare 🚀

Dermatology demand is climbing 🧴📈 Composite Score (0–1) = 50% current derm visits + 50% projected 5‑yr %‑growth Leaders: Texas, Florida, California. Fast risers: Idaho, Utah. Explore the map + bar ranks to target your next clinic. CurisData turns demand signals into smarter site picks. #Dermatology #HealthcareAnalytics #SiteSelection #HealthTech


California allergy hotspots 🤧📍 Our county Composite Score (0–1) equally blends current allergy visits and projected 5‑year %‑growth, spotlighting markets with both size and momentum. Explore the map + bar ranks and see where to place your next clinic with CurisData. #California #AllergyCare #HealthcareAnalytics #SiteSelection #HealthTech


Clinic visits are set to surge 18 % this decade—choose the wrong location and your build-out hinders profitability. We overlay real-world demand data of health so CurisData pinpoints tomorrow’s high-yield clinic sites today. Where will you plant your flag?

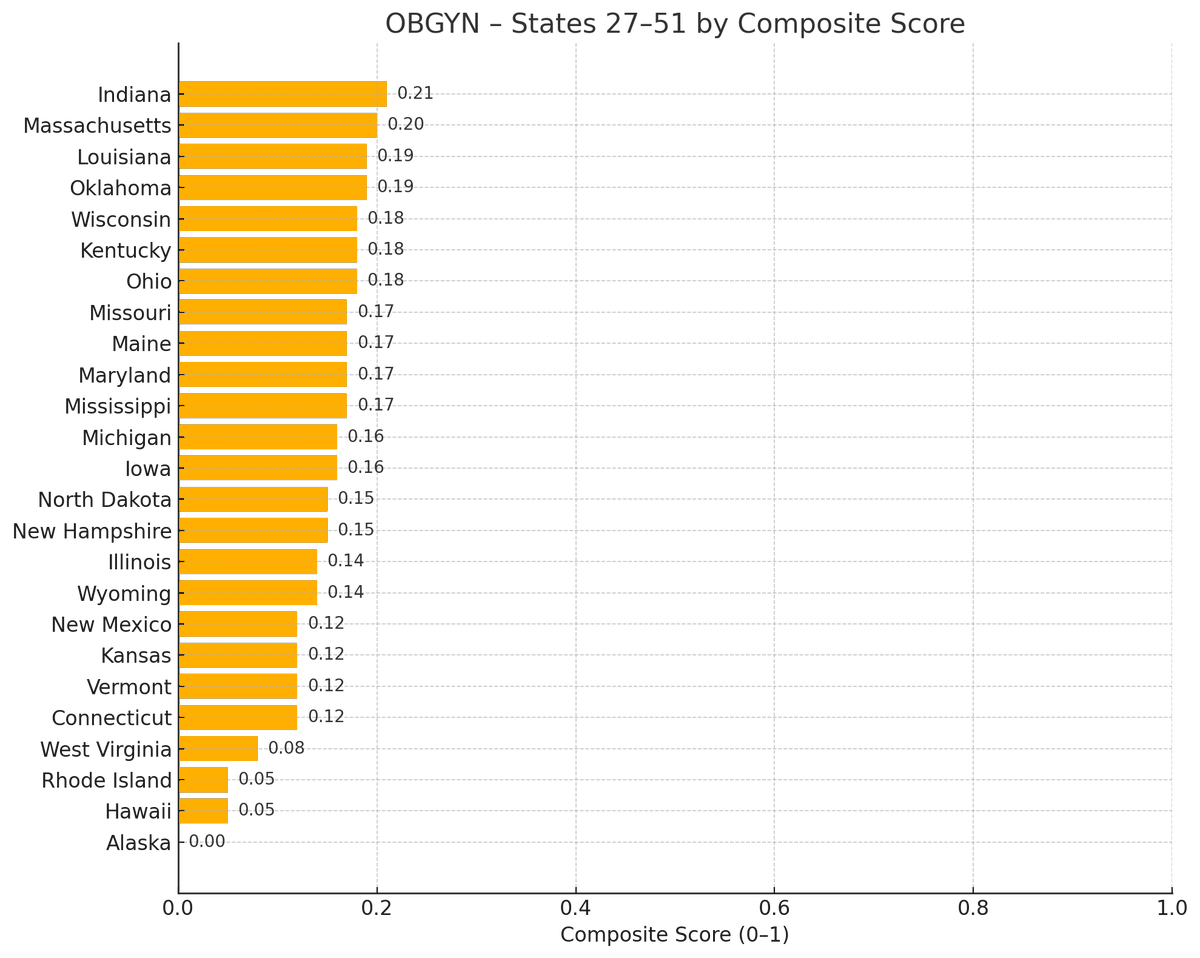
Delivering more care—OBGYN demand is expanding 👶🏥 🗺️ Opportunity map: Composite score (0–1) = 50% current OBGYN visit volume + 50% 5‑yr % growth 📊 Leaders: Texas, Florida, California; fast risers: Utah, Idaho. Most states are still trending up. 🔑 Why it matters for clinic developers & site scouts Higher birth volumes + women’s health utilization = fuller schedules, steadier occupancy, and stronger unit economics. #OBGYN #WomensHealth #HealthcareAnalytics #SiteSelection #HealthTech Data‑led site targeting shrinks scouting time and de‑risks build‑to‑suit projects. Ready to break ground where women’s health demand is rising fastest?


Allergy‑clinic heat check 🔬🏥 Our composite score (0‑1) gives each state an equal‑weight blend of current allergy‑visit volume + projected 5‑year % growth, so it captures both size and momentum. • Texas 0.83 and Florida 0.65 lead the nation. • Mid‑pack states like Colorado & Arizona still score above 0.35—there’s room to run. Want location intel this sharp for your next clinic? CurisData turns demand signals into smarter site picks. #HealthcareAnalytics #SiteSelection #AllergyCare 🚀 Data‑driven targeting slashes scouting time and de‑risks build‑to‑suit projects. Ready to translate these insights into break‑ground‑ready locations?


Texas primary‑care heat map 🩺🗺️ We scored every county on a Composite Score (0–1) = 50% current visit volume + 50% projected 5‑year %‑growth. Darker = stronger demand + momentum. Note: the lightest counties reflect limited/no data in this cut (shown as 0.00), not necessarily low opportunity. Ready to pinpoint your next clinic? CurisData turns demand signals into smarter site picks. #Texas #HealthcareAnalytics #PrimaryCare #SiteSelection #HealthTech


Why is CurisData different? We blend 18 years of site-selection knowledge with 97 % U.S. coverage of healthcare demand down to the zipcode. Healthcare demand data, payer-mix, competition—all layered into one map so the best location pops instantly. Ready to zoom in?

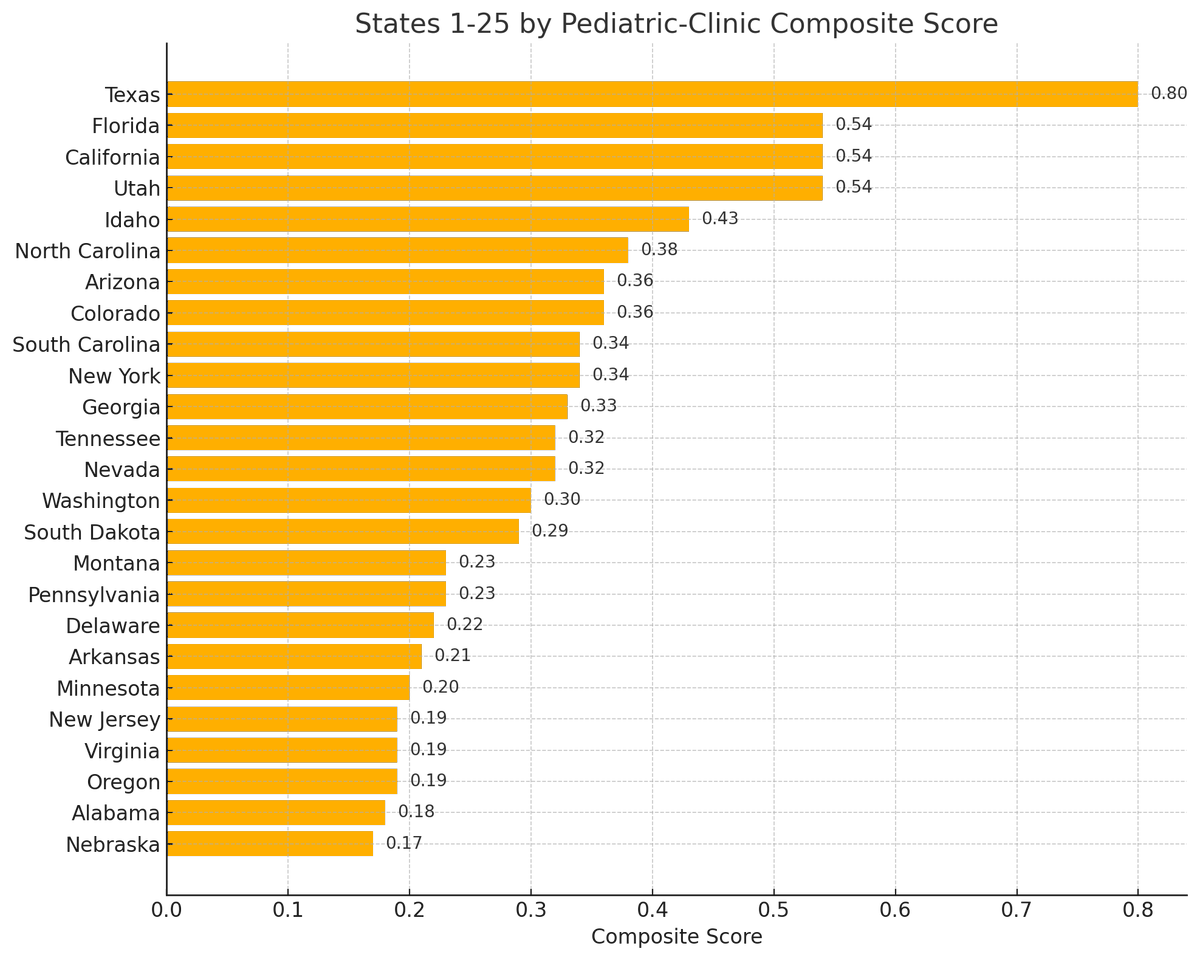
Pediatric‑care growth pulse 👶📈 Our composite score (0‑1) blends today’s pediatric visit volume with projected 5‑year % growth, an equal‑weight look at size and momentum. • Texas 0.80, Florida 0.54, and California 0.54 lead the pack. • Surging contenders like Utah 0.54 & Idaho 0.43 are worth a closer look. Pinpoint your next pediatric clinic. CurisData turns demand signals into smarter site decisions. #HealthcareAnalytics #SiteSelection #Pediatrics 🚀


Every great site-selection platform has a secret weapon—data. We deliver the full stack: de-identified healthcare demand data, demographics, and competitor heatmaps, refreshed monthly. CurisData is the data behind the tools that decide where healthcare grows next. Who powers your maps?

📊 Healthcare demand data you can depend on! At CurisData, we make it easy for healthcare real estate developers to access clear, reliable data for site selection. 💡 18+ years of site selection experience 💡 Healthcare + retail expertise 💡 Alteryx-certified engineers

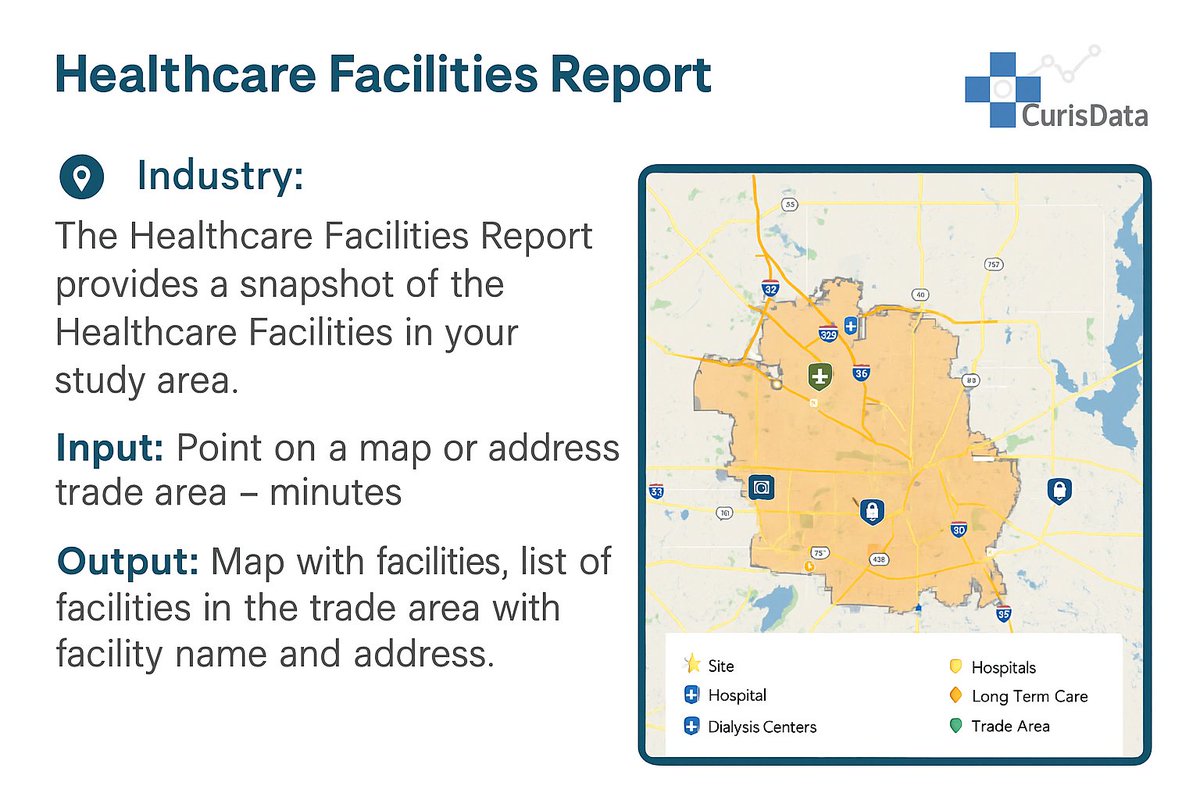
🏥 CurisData Healthcare Facilities Report Quickly map hospitals, long-term care, dialysis centers, and more in your study area. Get the insights you need to plan smarter, faster! 📍 Input: Any address or trade area 📊 Output: Facility maps + full name & address lists
📍 CurisData’s Physician Specialty & Affiliation Tool Get clear, actionable insights into physician distribution by specialty, hospital, and group affiliation—all mapped to your trade area. 💡 Make smarter decisions with data that pinpoints provider networks and service gaps.

📈 CurisData Healthcare Utilization Snapshot Quickly visualize the healthcare landscape in any area! Our snapshot tool identifies physicians, facilities, and demand for services — all mapped and ready for smarter decisions. #HealthcareAnalytics #CurisData #SiteSelection

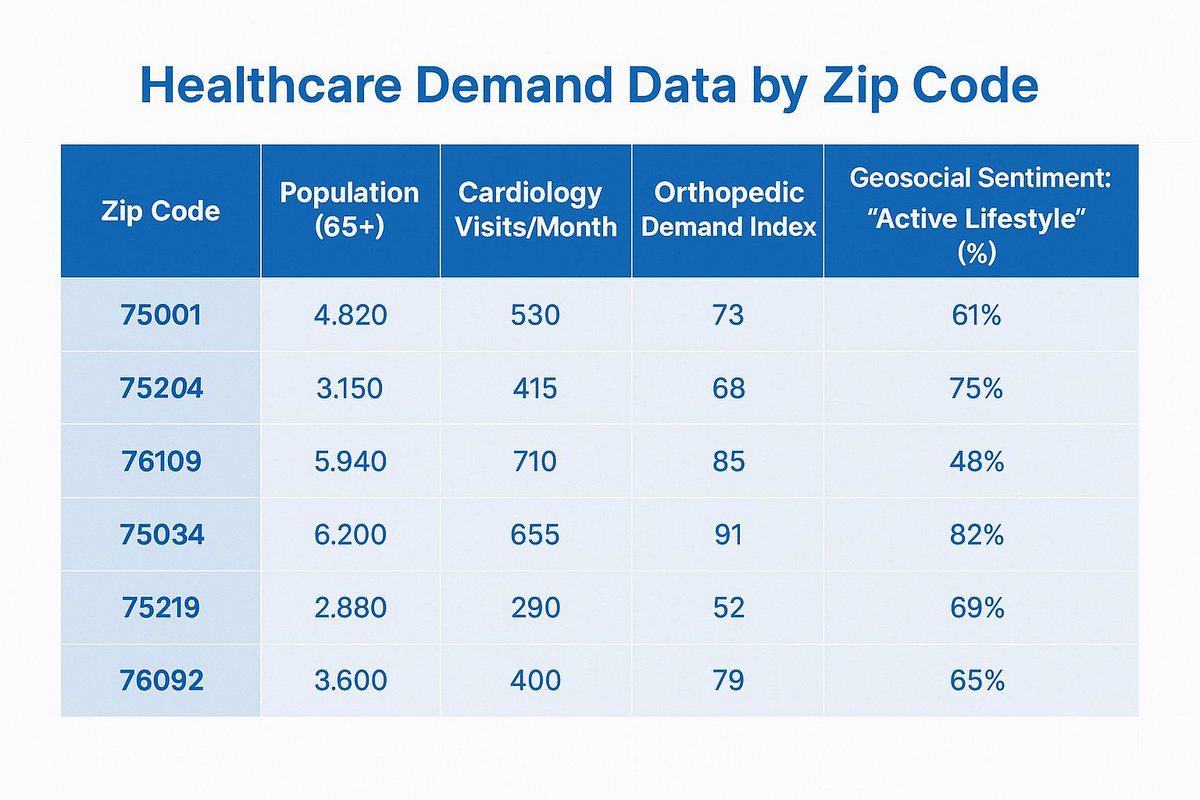
📍 Where is healthcare demand highest? Our latest zip code analysis reveals key insights on cardiology visits, orthopedic demand, and active lifestyle trends across regions. 📊 Use this data to prioritize smarter site selection and patient-centered growth. #HealthcareDemand

📊 Bring your market insights to life with powerful visualization tools. CurisData’s platform makes it easy to filter by specialty, payer type, and more, while analyzing trade areas, traffic, and competition with just a click. 📍 Smarter data. Better decisions.

📍 Smart Growth Starts with Smart Location Analysis See how pinpointing high-performing areas and identifying similar markets can help you expand with confidence. 🗺️ Data-driven decisions. 📈 Optimized networks. #LocationStrategy #MarketExpansion #HealthcareRealEstate


carrie fulghum @carrie_crowley
18 Followers 482 Following
Kevin Thompson @KevinTh26176052
0 Followers 3 Following
Commercial Real Estat... @maxfisherRE
14K Followers 658 Following 335 deals past 4 years. Commercial/Industrial real estate. 🏃♂️ultramarathon. T1D. Generator of CRE online leads. Guidebook 👇
Daniel Herrold @DanielHerrold
56K Followers 748 Following 20+ years in #CRE | MD at Porthaven Partners | Creator of @TenantExpReport | Honest insights on markets & life | Follower of Jesus | New chapter unfolding 🙏
Dataplor @dataplor
510 Followers 1K Following Precise global location intelligence: 370M+ places in 250+ countries & territories. Real-time updates & human-reviewed for confident, data-driven decisions.
Esri @Esri
189K Followers 65K Following Esri builds #ArcGIS, the leading location intelligence and spatial analytics software for mapping, 3D GIS, imagery, and geospatial app development.
Joe Francica @joefrancica
4K Followers 2K Following Location intelligence, analytics and artificial intelligences at it applies to geospatial technology.
Noam Ben-Zvi @Noam_BenZvi
305 Followers 113 Following CEO & Co-Founder, @Placer_ai - location analytics for any physical place. Try us for free at https://t.co/zfjzeNpGEr.
Placer.ai @Placer_ai
6K Followers 5K Following 📍The most advanced #locationanalytics platform for anyone with a stake in the physical world. #retwit #foottraffic Learn more @ https://t.co/s1SfNap7LB
encircle.io @encircleio
800 Followers 1K Following Actionable #Insights for brick-mortar #retailers by #Location #Analytics Platform. #AmbientIntelligence #IoT. Learn more at https://t.co/pBtlmEPUUh

Xite Healthcare Real ... @XiteRealty
140 Followers 253 Following Your trusted partner in healthcare real estate and practice sales. #healthcare #startup #growth #sellyourpractice
Seamus O’Brien @DentalREguy
745 Followers 233 Following Dental Real Estate Broker | $100M+ in Dental Office Sales | Helping Dentists Build Long-Term Wealth
Rahul Chhajed @RealEstateRahul
8K Followers 442 Following Built a $10M+ healthcare real estate brokerage team in 4 years. Sold $2.5B+ of real estate. Sharing my thoughts on real estate investing, markets, and business.
Blueprint Healthcare ... @BlueprintHCRE
419 Followers 413 Following The leading advisory firm exclusively focused on seniors housing and healthcare real estate. #BlueprintDelivers
Michael Moreno @HealthcareREguy
19K Followers 1K Following I sell the buildings your doctor works in. $2.5B+ in healthcare real estate sold. Real estate, markets, & investing, explained simply.
Site Selection @SiteSelection
7K Followers 2K Following The Premier Magazine of News on Corporate Facility Location & Area Economic Development.
Site Selection Group @SiteSelectionGr
1K Followers 654 Following Site Selection Group is a leading, independent location advisory and economic incentives firm providing solutions to corporations & communities across the world
Locate @LocateAI
127 Followers 185 Following The first tech-enabled brokerage in the retail industry.
IdealSpot @theIdealSpot
370 Followers 282 Following Revolutionizing commercial real estate with data-driven insights for optimal site selection. Empowering investors to make confident, informed decisions. 🔍🌎🏢
Analyze @analyze_corp
4 Followers 0 Following
UrbanFootprint @UFPlatform
5K Followers 5K Following The world's first Resilient Decision Intelligence platform, providing insights to those rebuilding & financing the world’s physical & social infrastructure.
CARTO @CARTO
31K Followers 6K Following The leading cloud-native spatial analysis platform, empowering all teams with insights directly in their data warehouse for faster, more accessible decisions.
PiinPoint @PiinPoint
1K Followers 2K Following The most accurate and easy to use site selection platform. We help restauranteurs, retailers, and brokers pick the best locations to maximize sales. (YC'14)
SiteZeus @SiteZeus
343 Followers 743 Following SiteZeus® is the leading location intelligence technology platform, building higher intelligence around location based decisions.
Horizon Analytics @HorizonSpatial
16 Followers 50 Following We help businesses find their customers using advanced mapping technology and quantitative data analysis.

Palmer Luckey @PalmerLuckey
848K Followers 2K Following I am a technology enthusiast, writer, and modder. Founder of @ModRetro, @Oculus VR, and @Anduriltech. Keeping American superheroes safe with autonomous systems.

Lawrence Lepard, "fix... @LawrenceLepard
253K Followers 29K Following Investment Manager, Equity Management Associates,LLC. Sound money advocate. Gold stock fund manager. Austrian economist. Anti-Federalist. CrossFit Athlete. #BTC
Lyn Alden @LynAldenContact
979K Followers 1K Following Author of Broken Money & The Stolguard Incident. Investor with a blended engineering/finance background. GP @egodeathcapital. Director at Bakkt & @Swan.
The Tenant Advisor @CoyDavidsonCRE
45K Followers 6K Following Tenant Rep | Office & Healthcare Occupiers | Portfolio Strategy & Transaction Management | MOB & Land Sales
Trends for United States
You might like