Search results for #ChartMill
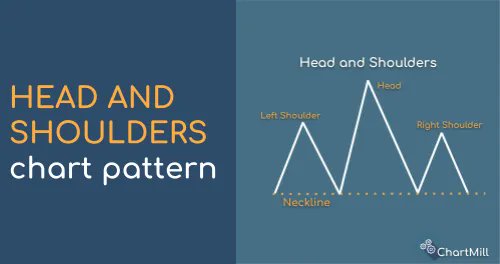
Head and Shoulders Pattern The head and shoulders pattern is one of the most well-known technical patterns within the field of technical analysis. The pattern is charac ... chartmill.com/documentation/… #chartmill #headandshoulders #stockscreener #chartmill #invertedheadandshoulders
How to measure a company's Financial Health? In this article ... chartmill.com/documentation/… #chartmill #financialhealth #currentratio #quickratio #altmanZ #debttoequity #chartmill #fundamentelscreener #netprofit #profitmargin #operatingmargin #solvency #liquidity #profitability

The Aroon Screening Capabilities and How To Use this Indicator in a Trading Strategy The Aroon indicator is available on the stock charts and in the stock screener. You can use it to find consoli ... chartmill.com/documentation/… #ChartMill #stockscreener #TechnicalIndicators #Aroon

The Bearish Engulfing Pattern | Definition What is the Bearish Engulfing Candlestick Pattern? Learn how to find it and trade it. chartmill.com/documentation/… #ChartMill #stockscreener #CandlestickPatterns #BearishEngulfing

Popular Screens: Strong Stocks near New High Stay in touch with the market and check which stocks are behaving the strongest. chartmill.com/documentation/… #ChartMill #strong #strongstocks

The MACD Indicator - Moving Average Convergence and Divergence Read all about the MACD(Moving Average Convergence/Divergence) Indicator in this article. chartmill.com/documentation/… #ChartMill #MACD #TechnicalAnalysis #TA

A CANSLIM stock screener – finding high growth market leaders This screener finds stocks which meet the CANSLIM criteria as defined by William O'Neill in the bestseller: "How to make money in stocks" chartmill.com/documentation/… #ChartMill #CANSLIM #GROWTH

Rising Wedge Pattern A rising wedge is a chart pattern characterized by two rising trend lines running in the same direction but with different slopes. The lower trend line is steeper than the upper ... chartmill.com/documentation/… #chartmill #risingwedge #{stockscreener #chartmill

Stock Market Golden Cross What Exactly Is The Stock Market Golden Cross? The Golden Cross is a term that resonates with seasoned investors and traders. It represents a critical technical analysis pattern that occurs when two ... chartmill.com/documentation/… #ChartMill #goldencross

Head and Shoulders Pattern The head and shoulders pattern is one of the most well-known technical patterns within the field of technical analysis. The pattern is charac ... chartmill.com/documentation/… #chartmill #headandshoulders #stockscreener #chartmill #invertedheadandshoulders

Finding Quality Compounders with Compounding Quality A screen for finding the best companies in the world, as described by @QCompounding (Compounding Quality) chartmill.com/documentation/… #ChartMill #QualityInvesting #StockScreener #Compounders

Price/Earnings-to-Growth Ratio (PEG) Price/earnings to Growth (PEG) is a valuation measure that compares the P/E ratio with expected earnings growth in an attempt to get a more accurate picture of the true intrin ... chartmill.com/documentation/… #chartmill #PEG #PEGratio #chartmill

Price/Earnings-to-Growth Ratio (PEG) Price/earnings to Growth (PEG) is a valuation measure that compares the P/E ratio with expected earnings growth in an attempt to get a more accurate picture of the true intrin ... chartmill.com/documentation/… #chartmill #PEG #PEGratio #chartmill

The Opening Range Breakout Strategy: Unlocking Profit Potential and Market Momentum The opening range is formed between the highest and lowest price, immediately at market ... chartmill.com/documentation/… #ChartMill #openingrange #openingrangebreakout #openingrangebreakoutstrategy
Market Capitalization explained Market capitalization - along with price and volume - is one of the basic characteristics on which you can select stocks for your portfolio. It mea ... chartmill.com/documentation/… #chartmill #marketcapitalization #marketcap #stockscreener #chartmill

Diamond Formation The diamond chart pattern is a technical pattern that can occur either at the end of a falling or rising trend. It is a powerful reversal pattern that - *unlike many other t ... chartmill.com/documentation/… #chartmill #diamondchartpattern #chartmill #stockscreener

Keltner Channels vs Bollinger Bands: Which One Is Better For Trading? In this article, we will explore the similarities and differences between Keltner Channels and Bollinger Bands and ... chartmill.com/documentation/… #ChartMill #keltner #keltnerchannels #bollinger #bollingerbands

Understanding the Aroon Indicator The Aroon-indicator is used to discover and anticipate new potential trends early on, identify sideways markets but a ... chartmill.com/documentation/… #ChartMill #aroon #technicalanalysis #aroonindicator #momentum #aroonstockscreener #aroonscreener

Popular Screens: Momentum Squeeze Play Setups using Bollinger Bands Squeeze plays are stock which are in a consolidation phase after a strong run up. Learn how you can find them on ChartMill. chartmill.com/documentation/… #ChartMill #squeeze #stockanalyzer

ChartMill @ChartMill
10K Followers 468 Following Financial Analysis and Stock Screening Software for for the American, European, and Canadian markets. 📈📊📉
Kristoff De Turck - C.. @KristoffDeTurck
552 Followers 89 Following - Co-founder ChartMill - (trail)running and Netflix-addict - Buy Tight, Sell Wide!
ChartMill BE NL @ChartMill_BE_NL
386 Followers 54 Following Financiële analysesoftware en screener voor de Europese, Canadese en Amerikaanse aandelenmarkten. Kwantitatieve fundamentele en technische filtermogelijkheden.
Chartmill_EU @Chartmill_EU
42 Followers 9 Following https://www,https://t.co/XiXW1J2Ffu is a website for stock screening and analysis. We cover the US markets and EU markets.
Chartmill Nederlands @ChartMill_net
168 Followers 22 Following


Utest ChartMill @UtestCM
1 Followers 0 Following
ChartMill @ChartMill5
0 Followers 26 Following I like fishing water Parks theme parks video game and other
ChartMill @mill_chart
0 Followers 82 Following Retired OR nurse, grandmother,great grandmother,love animals,gardening,and the beach.