Chart Seekers @chartseekers
"Helping All To Decode Charts & Master Market Structure" #Crypto #Commodity #Equity All my tweets for education & research purpose only Not a Finical Advice youtube.com/@chartseekers Global Joined August 2010-
Tweets3K
-
Followers2K
-
Following22
-
Likes3K
@LNChandra3 Nifty will do well in coming months
#Nifty50 Technical Outlook for tomorrow Nifty continues to hold above the key demand zone, indicating that buyers remain active at lower levels. The recent pullback appears to be a potential retail trap, as selling pressure failed to push the index below Support-1. As long as the 23,500–23,600 zone holds, the bullish structure remains intact. A sustained move above the immediate resistance zone around 24,250–24,400 could trigger the next leg higher toward Supply Zone-1 near 25,200–25,350. For now, watch price action around support and resistance closely. The weekly closing will be crucial in confirming whether Nifty is preparing for a breakout or needs more consolidation before the next move. 📈

$OIL $wti $brent we are about to test the monthly demand zone

$OIL $wti $brent may revisit the monthly demand zone and complete the ABC correction if price closes below the marked support and trendline. A breakdown here would add bearish confirmation and open the path toward lower demand levels.

$ETH Technical Analysis (4-Hour Time Frame) ETH/USD is currently trading around $1,673, holding above the key 4-hour support zone between $1,636 and $1,667. Price recently reacted from this demand area, indicating buyers are defending the level. Immediate Support: $1,636 Major Support: $1,561 – $1,545 Immediate Resistance: $1,755 Key Resistance Zone: $1,917 – $1,936 As long as ETH remains above the $1,636 support, the bullish recovery scenario remains valid. A breakout above $1,755 could trigger further upside toward $1,917 and $1,936. However, if price loses the $1,636 support zone, bearish pressure may increase, potentially driving ETH toward the $1,561–$1,545 support area. Bias: Neutral-to-Bullish above $1,636; Bearish below $1,636.

$spcx 4-Hour Time Frame Thought As expected, the stock attracted significant hype across the market, with the launch timing aligning closely with U.S. indices pushing toward all-time highs—a setup that often draws in retail participation. While the business story and market excitement captured attention, experienced wave traders focus on structure rather than sentiment. From a Wave Theory perspective, chasing hype is rarely the optimal strategy. Instead, disciplined traders wait for the B-wave retracement to develop before considering an entry. The current price action suggests that the market may still be forming a corrective structure, with the possibility of one more downside move before a larger trend unfolds. The key lesson is simple: hype creates emotion, but wave analysis provides a roadmap. Patience for the B-wave setup often offers a more favorable risk-to-reward opportunity than following the crowd at peak excitement.

#nifty50 going as per scheduling
#Nifty50 – Technical View for Tomorrow Nifty remains in a short-term recovery phase after bouncing from the 23,100–23,250 demand zone. Immediate resistance is placed at 24,270–24,440. A sustained move above this zone can trigger further upside towards 25,200–25,350 (major supply

$btc Bitcoin Weekly Outlook 📊 Little pain still seems pending before the next major move. Bitcoin is holding near a crucial demand zone, but volatility and further consolidation cannot be ruled out. 🔸 Bullish Scenario: Holding above support could fuel a recovery toward higher resistance levels in the coming months. 🔸 Bearish Scenario: A deeper sweep into the lower support zone may occur before a strong reversal emerges. Patience is key — the market may be preparing for the next big opportunity, but not without testing traders first. ⚡

#Nifty50 – Technical View for Tomorrow Nifty remains in a short-term recovery phase after bouncing from the 23,100–23,250 demand zone. Immediate resistance is placed at 24,270–24,440. A sustained move above this zone can trigger further upside towards 25,200–25,350 (major supply zone). On the downside, 23,500–23,630 acts as the first support, followed by the crucial 23,100 demand zone. As long as Nifty holds above 23,500, the bullish bias remains intact. Traders can watch for a breakout above 24,270 for fresh long opportunities, while rejection from resistance may lead to a pullback towards the support zone. Bias for Tomorrow: Mildly Bullish above 23,500; strong bullish confirmation above 24,270.
$eth ETH/USD Technical Analysis (4H) ETH remains in a broader downtrend but is showing signs of a short-term recovery after rebounding from the 1,545–1,560 support zone. Price is currently trading around 1,724, holding above the key 1,676 support level, which could act as the base for the next bullish leg. A successful hold above 1,676 may trigger a move toward 1,755, followed by the major resistance zone at 1,917–1,936. The chart structure suggests a potential impulsive advance if buyers maintain momentum. On the downside, a break below 1,676 would weaken the bullish outlook and expose ETH to a retest of 1,636 and 1,545 support levels. Traders should watch price reaction around the highlighted support zone for confirmation of the next directional move. Key Levels Support: 1,676 | 1,636 | 1,545 Resistance: 1,755 | 1,917 | 1,936 Bias: Short-term bullish above 1,676; bearish below it.

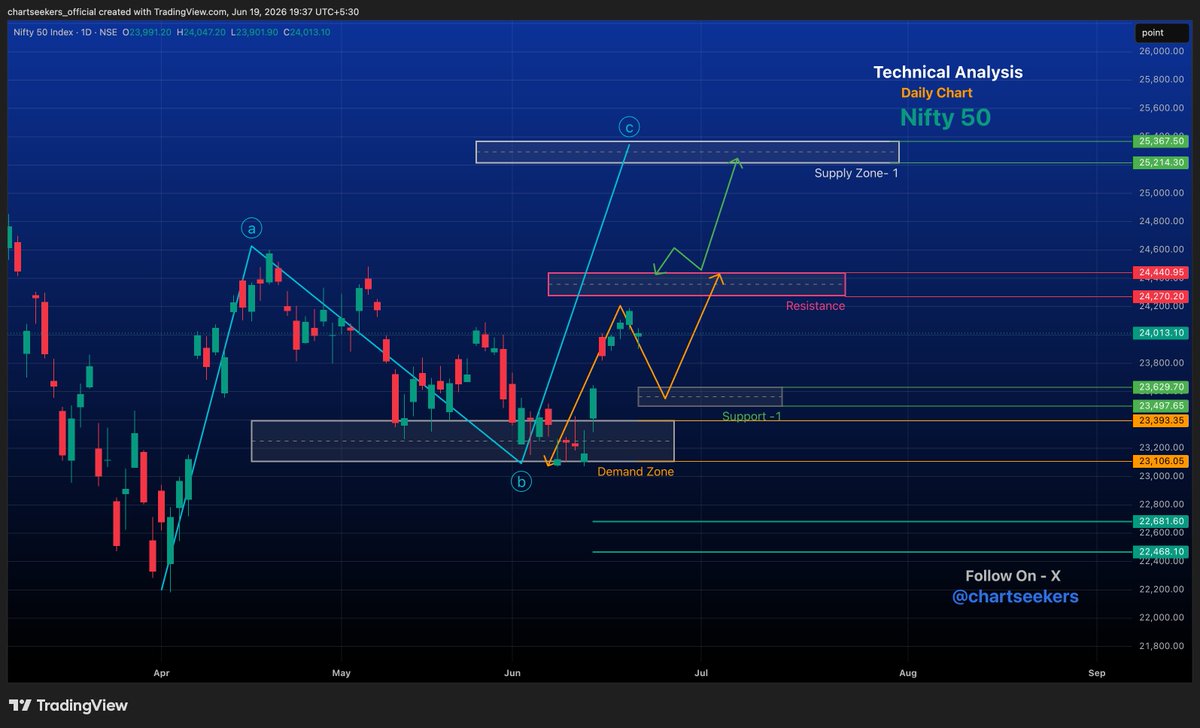
#Nifty 50 – Next Week Technical Outlook #Nifty50 ended the week near 24,013, showing a strong rebound from the 23,100–23,250 demand zone. The recent price action suggests buyers are defending lower levels, keeping the short-term bullish structure intact. For the coming week, immediate resistance is placed around 24,270–24,440. A sustained move and close above this zone could trigger fresh momentum, opening the path toward the major supply zone at 25,215–25,367. On the downside, 23,630–23,500 remains a key support area. As long as Nifty holds above this range, buy-on-dips strategies may continue to outperform. Any pullback toward support could attract fresh buying interest before another attempt at higher levels. Technically, the chart indicates a potential higher-low formation, which is often a precursor to an upward continuation. However, failure to hold above 23,500 may weaken sentiment and increase the chances of retesting the 23,100 demand zone. Bias: Bullish above 23,500; breakout confirmation above 24,440 for stronger upside momentum.
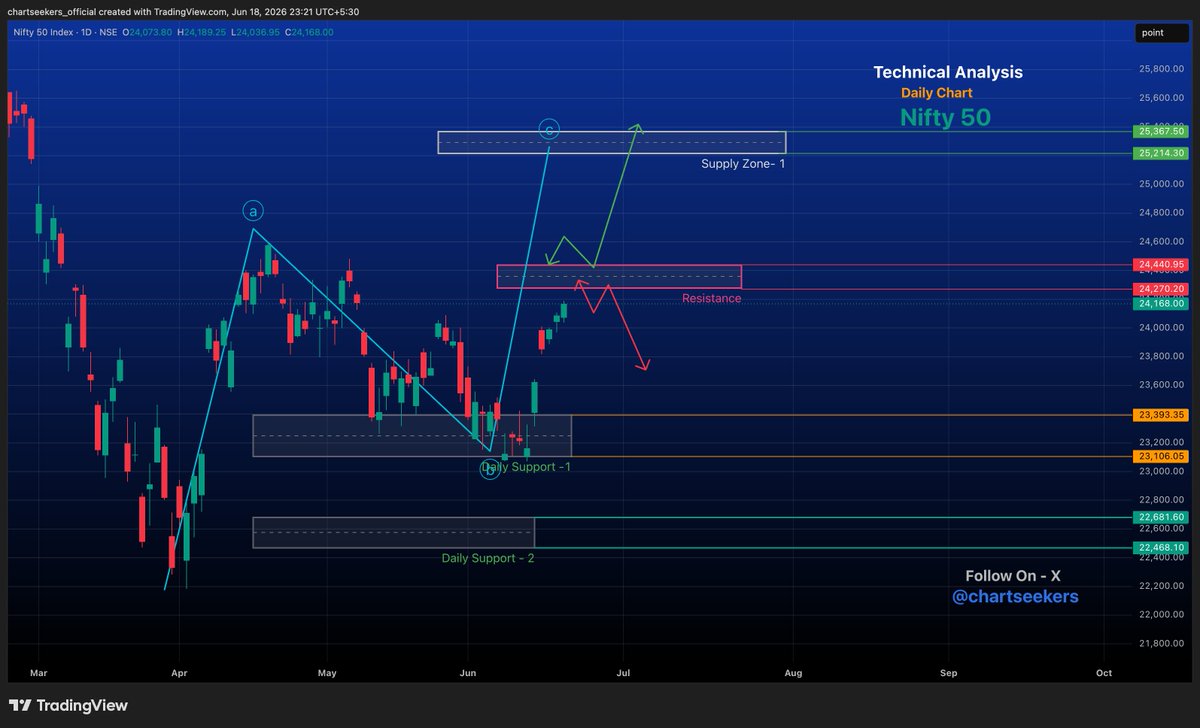
#nifty50 Daily Outlook (Tomorrow) Nifty closed near 24,168, showing strength after bouncing from the 23,100–23,400 support zone. The index is now approaching a key resistance area at 24,270–24,440. A sustained move above 24,440 could trigger fresh momentum towards 25,200–25,370. However, rejection from resistance may lead to profit booking, with immediate support placed at 23,900–23,400. we should watch the 24,440 breakout level closely for directional confirmation.
$NFLX Updating the chart levels Netflix Technical Analysis (Monthly Chart) The S&P 500 is trading near all-time highs, but Netflix is currently in a corrective phase. This is a perfect example of why investors should analyze stocks individually rather than assuming they will follow the index. An index reaching new highs does not mean every stock within it will do the same. Individual stocks move based on their own earnings, valuation, sector trends, and institutional activity. On the monthly chart, Netflix appears to be correcting after a major impulsive advance, with a key support zone between $51 and $68. While the broader market remains strong, Netflix is undergoing a normal price retracement. Key takeaway: Markets can make new highs while individual stocks correct. Always trade the stock’s chart, not the index’s headline.
$NFLX #Netflix just dropped an emotional season 📺💔 Started with a blockbuster rally, ended with an unexpected plot twist. Bulls: ‘Don’t worry, comeback episode is loading…’ Bears: ‘Nah bro, this series is getting canceled.’ 😭📉Welcome to the market — even charts have

#Nifty50 #Nifty 50 continues to recover strongly after defending Daily Support-1, indicating that buyers remain active at lower levels. The index is now approaching the key resistance zone around 24,270–24,440, which will be crucial for determining the next directional move. A decisive breakout and close above this resistance could open the path toward Supply Zone-1 near 25,200–25,370. However, failure to break above resistance may lead to a short-term pullback or consolidation before the next attempt higher. As long as Daily Support-1 remains intact, the broader structure favors the bulls.

$ETH Ethereum continues to show weak momentum on the weekly timeframe, with buyers struggling to demonstrate meaningful strength. As long as this weakness persists, the probability of price revisiting the lower support zone remains elevated. This week's closing will be crucial, as it should provide a much clearer picture of the market's next directional move. Until then, patience and risk management remain key.

Google Meet Link Below👇👇 calendar.app.google/Su6gXGU7JdwRhQ… 🚨 Crypto Market Update Tonight! 🚨 #Cryptocurrency market situation Join me on Google Meet at 10:00 PM IST as we break down the current crypto market situation. 📈 Bitcoin, Altcoins & Market Structure 🎯 Key Support & Resistance Levels ⚡ Potential investing Opportunities 🔍 What to expect next in the market Whether you're a trader, investor, or just crypto-curious, this session is for you. 𝕏: @chartseekers Telegram: @chartseekers See you at 10 PM! 🚀 #Bitcoin #Crypto #Ethereum #Altcoins #CryptoTrading #BTC #CryptoMarket #Trading

#nifty50 After completing a 5-wave downside structure, Nifty appears to be entering the early stages of a potential C-wave recovery. Although today's session closed with a red candle, the underlying volume profile indicates continued buying interest at lower levels, suggesting that bulls are still active despite intraday weakness. Price has respected the key support zone near 23,100–23,250, and the recent rebound from this area strengthens the possibility of an upward corrective move. As long as this support remains intact, the index may continue advancing toward the immediate resistance zone around 24,270–24,440. A sustained breakout above this hurdle could open the path toward the higher supply zone near 25,200–25,350. For tomorrow, we should watch for follow-through buying and a strong close above today's high as confirmation of bullish momentum. The broader structure remains constructive, with volume behavior favoring further upside participation in the sessions ahead. (NFA)

@LNChandra3 GOOGLE MEET TONIGHT WILL DISCUSS TECHNICAL
$TAO (Monthly Chart) – Technical Analysis TAO remains in a long-term bullish structure despite the extended correction from its previous highs. Price is currently trading around the $277 region, holding above the major Support-1 zone ($118–$200), which has acted as a strong demand area. The chart suggests a retest is still pending, with price potentially revisiting the highlighted retest zone before initiating the next impulsive move. The broader wave structure indicates that the corrective phase may be nearing completion, provided support remains intact. A successful defense of the support area could trigger renewed buying momentum and confirm a trend continuation. On the upside, the first key target lies within Supply Zone-1 ($646–$704), where sellers may re-enter the market. A decisive breakout above this resistance would open the path toward Supply Zone-3 near $1,380, representing a significant long-term bullish objective. Overall, the Monthly outlook remains cautiously bullish while price stays above critical support levels. (NFA)

$TSLA While everyone is celebrating new all-time highs in the S&P 500, I believe the market is flashing warning signs. The top looks increasingly confirmed, and the current rally may be setting up the ultimate retail trap. Tesla's technical setup is particularly concerning. A monthly close below the highlighted level could open the door to a significant downside move and mark the beginning of the long-awaited C-wave decline. The crowd is chasing highs. Smart money is watching key support levels. Be prepared.

$OIL $wti $brent going as per scheduled

$OIL $wti $brent may revisit the monthly demand zone and complete the ABC correction if price closes below the marked support and trendline. A breakdown here would add bearish confirmation and open the path toward lower demand levels.

Aman Aulakh @_AmanAulakh
37 Followers 97 Following
kaviyaram @kaviya33052425
814 Followers 3K Following 📈 Trader | 10+ Years Experience 🎯 Options & Intraday Trading 📊 Daily Trade Setups & Market Updates 💰 Risk Management Focused 👇 Join Our Trading Community

william wu @williamwu197619
19 Followers 96 Following


Shivam Pandey @shivampandey_04
95 Followers 34 Following हर बार माधव गीता का ज्ञान देने नही आएंगे अर्जुन को खुद ही धर्म की रक्षा के लिए गांडीव उठाना पड़ेगा 🙏🏻गाण्डीव धरकर केशव संग आऊंगा, शंख वही पे बजाऊंगा.....!


✈️AirDrake✈️ @AirdrakeTrades
5K Followers 164 Following Tweets are here just for sheets and giggles.

Ali Hirsi @alihirsi109
12 Followers 156 Following
HeyItsGita @SuryaThase
33 Followers 89 Following
Jamila yusuf @JamilaYusu12324
14 Followers 45 Following
rachi Q @ddabong8989
26 Followers 148 Following


Abu Nazeer @NazeerAbu49605
20 Followers 106 Following
Priyanshu Mishra @PriyanshuM2112
6 Followers 30 Following

rajan gupta @7Rajan8
90 Followers 149 Following
Takiya @teguh3220
92 Followers 2K Following


maczoo @maczoo27073
10 Followers 129 Following
Ufukeray41 @ErayUfuk
15 Followers 18 Following
faldy kaka @FaldyKaka
9 Followers 41 Following
ramachandra @ramacha93129504
83 Followers 1K Following
Patricia @cortez11patrici
497 Followers 4K Following If It Sounds Like A Bad Idea... I'm Probably Already Doing It


Thorfinn @ThorfinnBTC
2K Followers 3K Following i share sweet, happy & heartwarming content from various sources. I may don’t own any content. For credit or removal, please DM us.
vensder @v3n5d3r
365 Followers 5K Following SRE, DevSecOps, Linux, Open Source && Open Heart | Header image by Gregory Maxwell, GFDL 1.2 | https://t.co/xNcjOBrylS


bkman71 @bkman440
188 Followers 817 Following
Tabit Abokhris @TAbokhris91256
376 Followers 3K Following
Trade&HoDL @TradingAndy008
368 Followers 2K Following My trading journal & journey presented as reshares, and the occasional post 🚀 DYOR - Dont copy trade
Le @ler062787
106 Followers 1K Following

A @Abijith28852265
0 Followers 2 Following

THENTV @Thentv3
21 Followers 227 Following
Abubakar @Abubakar1343022
7 Followers 143 Following
Abhinandan Bohra @AbhinandanBohr3
526 Followers 2K Following 🏆No risk, no story.🏆 🤙Dream big, work hard, stay focused😍 👑King of my own world.👑 Born to be awesomE BIG INVESTORS OF BTC CRYPTO LOVER💕 MID CAP CRYPTO🤑
ahmy @ahmyupr6
0 Followers 14 Following
Sweet Dream @Strongmanalex50
389 Followers 3K Following
Vijay Rajawat @vijayrajawat181
93 Followers 1K Following
Govindsingh Purohit @123govindsingh
30 Followers 423 Following Chartered Accountant (FCA), Certified Fraud Examiner (CFE), Anti Money Laundering Specialist, Forensic Accounting Investigator, Trainer (In Forensic Accounting)

Sei @SeiNetwork
769K Followers 390 Following The Blockchain for Trading • Infrastructure for the modern economy • RT ≠ endorsement • Account managed by @Sei_FND

Cetus🐳 @CetusProtocol
464K Followers 280 Following The leading DEX and liquidity infra on #Sui. #Cetus, where on-chain trading happens. 🌊 🐳
Framia Pro by Converg... @FramiaPro
771 Followers 6 Following All-in-One Creative AI Agents Platform Framia Pro by @ConvergeAI_X Video Agent | Design Agent | Music Agent 20+ Top AI Models in One Subscription
Modified Dow Theory S... @CaptainScio
10K Followers 847 Following Wealth Fund Analysis For Indexes, USD, Oil, BTC, ETH, Silver, Gold, 10 Year Bond I track the real trend, not the noise. I follow back but should be verified.
Extended @extendedapp
29K Followers 47 Following Perp Dex built by ex- @Revolut team. Info only. No advice, offer or solicitation. Eligibility and availability subject to local restrictions.
Entertainers Cricket ... @eclt10league
4K Followers 26 Following Where serious cricket meets fun content! 🎥🏏 India's top cricket league for social media stars!
Sunil Aggarwal @Trustmachines11
49 Followers 129 Following Founder, dropD Network, commitment dating with smart contracts; Author, BITCOIN MAGNET; Ex-Dean, Blockchain Programs, TalentSprint (2018-24)
Sunil Aggarwal @Trustmachines
6K Followers 4K Following Steward-in-Chief, dropD network, dating commitment with smart contracts; Author of BITCOIN MAGNET; Ex-Dean, Blockchain Programs, TalentSprint (2018-24).

1 Billion Followers S... @1billionsummit
9K Followers 2 Following The world’s largest content creator economy summit.
India Blockchain Week... @IBWofficial
9K Followers 14 Following Hosted by @HashedEM, powered by @w2_community
Devcon 8 | Mumbai, In... @EFDevcon
48K Followers 11 Following The flagship event by @ethereumfndn. Devcon 8: Mumbai, India 3-6 Nov 2026.
Bitcoin MENA Conferen... @bitcoinmenaconf
16K Followers 481 Following The biggest #Bitcoin conference in the Middle East 🇦🇪 | Returning December 2026 🔥| Grab your early bird pass 👇
Visual Education @VisEduStudio
154 Followers 41 Following Formerly Karl Taylor Education (@karltaylorphoto) Online Education across the Visual Arts - Lighting, Photography, FIlmmaking, Post-Production, CGI.
Karl Taylor @karltaylorphoto
8K Followers 340 Following For photography and visual arts education follow: @VisEduStudio
CryptoSingh.eth/btc/s... @opinderpreet
8K Followers 3K Following 10+ years in crypto, DeFi is 1st love, Janitor @vannaprotocol, Ex- @chainassets, @aave, @koinfox, @musigmainc , Ex-Blockchain Faculty(ICAI, NPTI )
ETHGlobal @ETHGlobal
107K Followers 2K Following We help builders bring the vision of Ethereum to life. Hosting @ETHConf in NYC, June 2027.

TOKEN2049 @token2049
149K Followers 722 Following #TOKEN2049: The World’s Largest Crypto Event. 🌏 Singapore: 7-8 October 2026 🌍 Dubai: 21-22 April 2027
Pardeep Kumar @whopardeepp
44 Followers 54 FollowingYou might like