WTFViz @WTFViz
#dataviz and #infographics that make no sense. Submit your finds: http://t.co/rfiMnNfcEV viz.wtf Infographics Everywhere Joined September 2013-
Tweets2K
-
Followers6K
-
Following105
-
Likes2K
📷 Presumably generated based on the relative diameters of thr circles, not their relative areas. It’s subtle but still misleading. From Women in the Workplace 2021 published by McKinsey & Company. tmblr.co/ZfWDdqbOLHYwOi…
Fun activity: draw the rest of the circular pie chart in a way that makes the chart areas match the percentages tmblr.co/ZfWDdqbO0icw0m…
Time dilation spiraling out of control. tmblr.co/ZfWDdqbNi5Cdum…
the drying time could be literally anything and the “easy to dry” arrow exceeds the claimed 85% decrease by a lot tmblr.co/ZfWDdqb3kwiOWm…
📷 Great Britain (Wielka brytania) got to have its very own right Y axis. tmblr.co/ZfWDdqb3QKEb4y…
📷 trying to understand the salary range for my profession, why is this a bar chart? tmblr.co/ZfWDdqaunhi54e…
one description matches the bar, the other totally doesn’t tmblr.co/ZfWDdqauT62Fiq…
📷 Linear time is an illusion. Your weeks are just gumballs in a vending machine. tmblr.co/ZfWDdqao16c6ey…
In which 23% is visibly larger than 33% tmblr.co/ZfWDdqaniWbMOy…
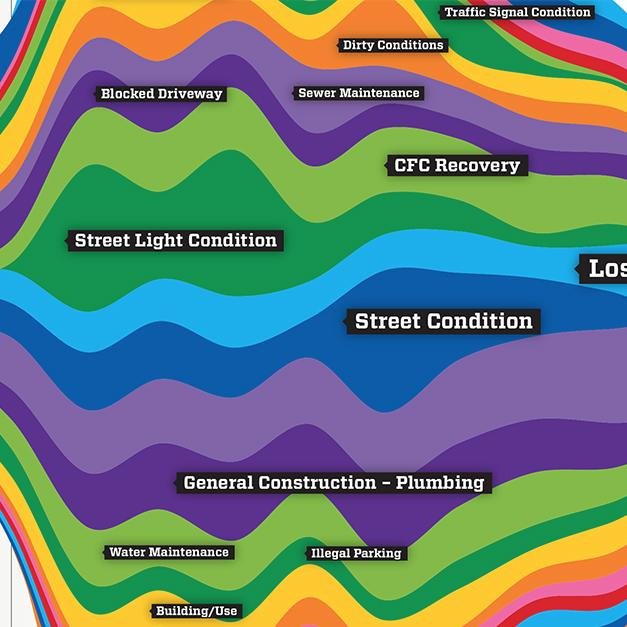
📷 Is this random clipart, or an actual representation of the data discussed in the article? How do the bars and pie slices relate to each other? WTF is going on here? tmblr.co/ZfWDdqac6xZ4iW…
📷 No scale and misleading advertising. (Libro.fm does not share 50% of its profits with bookstores). Pretty sad when their whole marketing campaign is how they are supposed to help indies more than amazon. tmblr.co/ZfWDdqab97iqWy…
📷 The X-Axis is supposed to be backwards, right? tmblr.co/ZfWDdqaaqXD2aW…
📷 I asked a coworker how much overtime her salaried staff worked last year. I got this. In addition to graphic terrible-ness, all the numbers are entered as text. tmblr.co/ZfWDdqaaVx1oOe…
📷 “Desiderable Future”, official infographic of the government of Spain on the future of the country, from the published document “Spain 2050”. tmblr.co/ZfWDdqaC2NQjqi…

Alberto Cairo @AlbertoCairo
68K Followers 5K Following For news, follow me on BLUESKY: https://t.co/nN8zwUEmZs and LINKEDIN: https://t.co/BV7fInzN6w
Nadieh Bremer @NadiehBremer
48K Followers 579 Following Data Visualization Artist (+ graduated Astronomer ✨) with a love for Data & Generative Art | 🇳🇱 https://t.co/2QeuXCOGlo
Yan Holtz @R_Graph_Gallery
19K Followers 723 Following Software engineer who ❤️ #dataviz. Creator of https://t.co/sj29jZPkYr and the R, Python, D3 and React graph galleries. ➡️ https://t.co/PoJNeHXz8a 📈 🌊 🍺
Kevin Flerlage @FlerlageKev
16K Followers 3K Following Tableau Evangelist/Data Visualization Consultant at Moxy Analytics | 5X Tableau Visionary | 5X Tableau Public Ambassador | One Half of the Flerlage Twins
Ben Jones @DataRemixed
15K Followers 3K Following Founder & CEO @dataliteracycom, author of Data Literacy Fundamentals https://t.co/5j23m0lirz & Learning to See Data https://t.co/WilvUprjpB. Love nature over tech
Neil Richards @theneilrichards
8K Followers 1K Following Tableau Visionary Hall of Fame & Public Ambassador | Global Data Fluency @JLL | https://t.co/q1nvEnM4QD | Questions in Dataviz book released Nov 2022
Alex Selby-Boothroyd @AlexSelbyB
21K Followers 5K Following Head of data journalism at The Economist. I ❤ charts
Christina P. Gorga @StyleSTEAMed
3K Followers 3K Following Tableau Social Ambassador | @DatafamCon co-runner | Aspiring Community + COE Builder | ‘18 @Tableau Community Founders Award Winner | BLE (Big Leo ♌️ Energy)
Voilà: Francis Gagno.. @chezVoila
3K Followers 1K Following Now on BlueSky | Information design studio focused on sustainable development. Since 2013. Gold @ Info is Beautiful Awards. Tweets by FG, founder.
Evelina Judeikytė @parabolestudio
4K Followers 1K Following Data storytelling for mission-driven orgs 🎯 Founder of Parabole Studio 📡 Learn data storytelling with me 👉 https://t.co/fVmB5ujjCI
Cole Knaflic @storywithdata
35K Followers 774 Following Helping people create graphs that make sense, present powerfully. CEO & author of #daphnedrawsdata, #storytellingwithyou, #SWDbook & #SWDletspractice!
Bridget Cogley, #Find.. @WindsCogley
5K Followers 2K Following CVO @Versalytix. #FunctionalAestheticsTheBook coauthor. Maker of vizzes, breaker of calcs, Tableau-old (HOF). @[email protected] she/her
Lindsay Betzendahl @ZenDollData
11K Followers 2K Following 5x #TableauVisionary, 5x @tableau Public Ambassador | 11x VOTD | @vizhealth, views are mine | Creatively #ADHD | #projecthealthviz #momswhoviz #datafam #data24
Andy Kriebel @VizWizBI
34K Followers 2K Following Global Head Coach @ The Data School | Tableau Visionary HOF | Training the next generation of great data analysts. Tweets & threads to help you be great too.
Andy Cotgreave @acotgreave
18K Followers 1K Following Tableau evangelist + data communicator. Newsletter: https://t.co/OMuuEiRcbB More likely to be here: https://t.co/9Jfw6GyQli
Marco Russo @marcorus
25K Followers 482 Following Consultant, speaker, book writer, mentor. Business Intelligence with Power BI, Analysis Services, and Power Pivot. Other info on https://t.co/In7OCrB3vT
Wisevis, dataviz for .. @wisevis
5K Followers 2K Following Hi, I'm Jorge Camoes, #dataviz consultant & trainer (Excel, PowerBI, Tableau). My book: https://t.co/x5nJ2y2qUM. The other one: https://t.co/23Z4SqzTzz
Information is Beauti.. @infobeautyaward
16K Followers 2K Following The year's finest data visualization & infographics, judged by the public and a panel of 40+ dataviz experts. Presented by @DataVizSociety.
Jacqui Moore @jaxx084
2K Followers 2K Following Tableau Visionary | Tableau Ambassador 4x | Co-Lead of the Boston TUG and #RWFD | Here for the #DataFam | Opinions my own


chunsiknoh @guurank
231 Followers 1K Following Trading crypto and listen to music is my life | Opinions are my own and not the views of my employer #gamefi
Bora (😃,∞) @boratheworld
2K Followers 2K Following vibes @ethosstake ∞/acc | hedge @dydx_grants | prev @keplrwallet @osmosiszone
Nupur @nnupurjoshii
2K Followers 294 Following currently working in climate and finance | alum @columbia. Past - Investments @TheiaVentures Product @add_axio @zerodhaonline
Sophie Purdom @SophiePurdom
11K Followers 2K Following investing in early stage 🌎 startups at Planeteer Capital & writing about the future of @climatetech_vc
David Ellicks @RamsSB14Bound
131 Followers 290 Following

Maty 4 @Noblematiasok
213 Followers 2K Following
gastón m. ⭐⭐⭐ @emegaston
2K Followers 2K Following 💻📲 Patagónico inquieto. Comunicador y consultor digital. ✍️📸 Escribo y saco fotos. 🏳️🌈

Fala @fedefalavigna
383 Followers 1K Following En @nflnohuddle intentando difundir el Football 🏈 de la #NFL BOCA
Kevin Roberts @kevinroberts07
133 Followers 187 Following Christian, Husband, Father, Amateur Foodie
Anya Hordijk @latjuba_nl
248 Followers 485 Following Photography | Books | Travel | Yoga | Amsterdam | IJburg
Walter Caballero @wdcaballero
302 Followers 2K Following Hola ! Soy estudiante de Lic. en Computacion en la UNSL y trabajo de Programador Web. Mis pasiones son Independiente y la musica electronica !

Jared @jjdagr8est
285 Followers 292 Following
Shir Wein @WeinShir
117 Followers 1K Following Computational Social Science enthusiast • Text&Networks analysis • In love with Pandas (the library😉) •Entrepreneur's mind.Athlete's body.Artist's soul~J.Clear
Jerome Roehm @TheJeromeRoehm
241 Followers 399 Following Asst Prof of Math and Data Science at Doane University. Retired athlete. I like teaching, math, sports, and most other things. I love my family.
Marloes @Marloe5
78 Followers 211 Following
Carter Ray @Carter_Ray
161 Followers 581 Following GIS | Cartography | Orioles | Spurs | University of Maryland
Vandranki Prabhu kira.. @KiranVandranki
0 Followers 1 Following
Setsushinn @hugh10060669
200 Followers 2K Following in prehendo-endi-ensum: to discover, to see, to perceive, to realize, to capture
Vlpem @emivlpc
165 Followers 952 Following
Astrid Z. @Z_Astrid
65 Followers 249 Following Communication Design Bachelor / Infographic Designer / Teamlead Infographics at Wort & Bild Verlag / private account

Eisa Saleh @eisa_saleh_
3 Followers 17 Following
Emmanuel @Sociolink
8 Followers 112 Following

Sorami Hisamoto @sorami
1K Followers 685 Following 「思考のための道具」に興味があります。 データ可視化、地図、自然言語処理などをやっています。 ソフトウェアエンジニア @MIERUNE_inc
Don Waisanen @DonWaisanen
2K Followers 1K Following Professor of Strategic and Leadership Communication at Baruch College, City University of New York, Marxe School of Public and International Affairs.
Jonatan Rodrigues @JonatanRodrigs
24 Followers 304 Following Content Producer na RD Station. Aprendendo novas maneiras de unir Comunicação e Dados para contar boas histórias.
theddywijaya @pathedwijaya
82 Followers 379 Following
Robby Harfianto @HarfiantoRobby
76 Followers 104 Following
Roliyo @Roliyo5
1 Followers 12 Following

Maria J A @majoarroyo0291
1 Followers 100 Following
Erfan Mostafavi @ErfanMostafavi
263 Followers 517 Following
siculo83 @siculo83
29 Followers 235 Following
. @Danish_karem
18 Followers 36 Following

Phares Muruthi @SimbaMkenya
3K Followers 5K Following Javascript Rockstar | D3 js Expert #D3JS #DATAVIZ Svelte | Typescript Open to freelance work @[email protected]
Maria Sepanmaa @MariaSepanmaa
0 Followers 4 Following
Dirk Pijpops @DirkPijpops
145 Followers 96 Following

Johannes (Jeroen) Pul.. @jwmpullens
146 Followers 226 Following #Assistantprofessor #greenhousegas and #agriculture at #Aarhus University
Jake Gulinello @Jake_Gulinello
13 Followers 159 Following
Dennis Kao @professorkao
2K Followers 1K Following Social Work Professor | Data Viz & Map Designer | @Tableau Visionary & Public Ambassador | Health Equity & Social Justice | QGIS | he/him/his
Abhishek G S @x_gsa_x
8 Followers 220 Following
Maulana @ammfattah
1 Followers 101 Following
Alberto Cairo @AlbertoCairo
68K Followers 5K Following For news, follow me on BLUESKY: https://t.co/nN8zwUEmZs and LINKEDIN: https://t.co/BV7fInzN6w
Jon Schwabish @jschwabish
24K Followers 993 Following 📈Economist & DataViz 🕸@urbaninstitute @PolicyViz 🎙PolicyViz Podcast 📺YouTube step-by-step tutorials 🗞On Substack: https://jschwabish.subst 👀All views mine
Andy Kirk | Visualisi.. @visualisingdata
57K Followers 1 Following Independent data visualisation expert: Designer, consultant, trainer, lecturer, author, speaker, host of ‘Explore Explain’ series. *Cross-posting*
Voilà: Francis Gagno.. @chezVoila
3K Followers 1K Following Now on BlueSky | Information design studio focused on sustainable development. Since 2013. Gold @ Info is Beautiful Awards. Tweets by FG, founder.
@[email protected].. @JanWillemTulp
14K Followers 1K Following Hello, I create data visualizations @ TULP interactive - https://t.co/opOLGmCwV7 upcoming course: https://t.co/1jegKuDIQq @[email protected]
Information is Beauti.. @infobeautyaward
16K Followers 2K Following The year's finest data visualization & infographics, judged by the public and a panel of 40+ dataviz experts. Presented by @DataVizSociety.

Joe DiNoto @mathteacher1729
1K Followers 1K Following I am a data scientist by way of mathematics education, #RStats user, problem-solver, and juggler. All tweets my own.
Rudi Shumpert @RudiShumpert
4K Followers 933 Following Western Carolina Dad, Scouter, Digital Data Plumber, Clemson Alum | Sr Evangelist @ Adobe. comments mine. Ally. He/Him VoteBlue, World Champion Curmudgeon
ZingChart @ZingChart
3K Followers 793 Following A powerful #JavaScript charting library. Tweet at us for help with your #charts!
Tyler Vigen @TylerVigen
14K Followers 659 Following My defining qualities are curious and stubborn. Creator of spurious correlations: https://t.co/dPthBYVEhE
Amy Hogan @alittlesta.. @alittlestats
3K Followers 494 Following Statistics & Math Teacher|Math Team Coach|MƒA Master Teacher|NCTM/ASA joint committee K-12 stats ed|Smithie|#rstats beginner|she/her|20th percentile for height

IDEO @ideo
349K Followers 5K Following IDEO is a global design company. We believe a better future is for all of us to design.
fmina @fmina
1K Followers 3K Following Designer, dad, assistant managing editor @seattletimes. Formerly deputy managing editor, @sfchronicle

Mike Bostock @mbostock
66K Followers 9 Following Visualization toolmaker. Co-founder @observablehq. Creator @d3js_org. Former @nytgraphics. Pronounced BOSS-tock.
Ian Johnson 💻🔥 @enjalot
8K Followers 1K Following Latent Interfaces 🎥 https://t.co/wnTOSnVApZ 💾 @observablehq, @google, @lever
Benjamin Wiederkehr @wiederkehr
2K Followers 263 Following Swiss interaction designer based in Colorado, co-founder & director of @ixt, co-organizer of @datavisZRH, previous editor of @datavis.
Data Stories Podcast @datastories
17K Followers 117 Following A podcast on Data + Visualization with @filwd and @moritz_stefaner. Support us on Patreon! https://t.co/yzUaNPR2l9.
Moritz Stefaner @moritz_stefaner
20K Followers 2K Following Crafting data experiences at https://t.co/1OMc7l9A96 / Podcast @datastories / Mastodon https://t.co/ZLcsQpK88Y
Data Pointed @DataPointed
8K Followers 985 Following Stephen Von Worley. Data visualization and words: https://t.co/G908V2HFmI About: https://t.co/xpBlnBfHab
Enrico Bertini @FILWD
14K Followers 470 Following Faculty@Northeastern in Boston. Working on Data Visualization. Italian 🇮🇹. Father of 3. I have a newsletter → https://t.co/tVY6g22ni6.
NewPaltzDH @DHM293
125 Followers 157 Following Digital Tools for the 21st Century: Sherlock Holmes’s London is an intro to #digitalhumanities @newpaltz . Run by @annieswafford
Annie Swafford @annieswafford
3K Followers 3K Following Queer and disabled writer (#mcas #hEDS) Also a former academic. She/they.

Katie Park 박유미 @katiepark
4K Followers 471 Following Code + data journalism at @MarshallProj, previously @nprviz + @postgraphics. Tampa-raised. Guitar/vox @badmovesdc. They/she.
Manuel Frias @manolofrias
727 Followers 862 Following I like making charts and maps. Now back at @HELCOMInfo
Marco Liberati @dej611
451 Followers 531 Following Ex @CambridgeIntel, @improntaAdvance, @Linkurious. Now @Elastic. Coder, Data Visualiser and Tiramisù artist. Opinions are my own.
Tamara Munzner @tamaramunzner
8K Followers 419 Following UBC computer science professor, visualization. She. Now mostly at @[email protected]


John Hodgson @BlizzJohnzee
1K Followers 164 Following Sr. Technical Designer at Blizzard Entertainment - Heroes of the Storm. My opinions my own and are usually totally incorrect.
Jerome Cukier @jcukier
8K Followers 1K Following engineer at @google assistant. all charts are beautiful
Bastian Grossenbacher.. @Pseudomanifold
5K Followers 981 Following Dad · Neutral good · Topology & Geometry + ML · PI @HelmholtzMunich · Faculty @TU_Muenchen Feedback? https://t.co/w8J3u9u5JS
Lars Schubert @graphomate
1K Followers 669 Following Data visualization | extensions for meaningful #dataviz | Power BI | Tableau | SAC | MS 365 | SAP Business Objects | IBCS ... Modular Synth addicted
Stuart Palmer @s_palm
2K Followers 337 Following Professional engineer. Recovering academic. Working with data to improve work safety in Victoria. Opinions my own.

Trifacta is now part .. @Trifacta
11K Followers 1K Following Follow us on @alteryx for continued Designer Cloud #DataEngineering innovations. Experience the power of #AnalyticsForAll with #AnalyticsAutomation!
Cedar Riener @criener
4K Followers 2K Following Cognitive/perceptual psychologist. Chair, Department of Psychology & Neuroscience, Randolph-Macon College. Applier of cogsci to education. He/him.
Math Curmudgeon (& bl.. @MathCurmudgeon
1K Followers 663 Following ~40 years teaching HS math, physics & computer science. He/Him/Sir/Mr. Mac/Alaxandr "Þæs ofereode, þisses swa mæg." "That passed; this too shall pass."

Bloomberg Graphics @BBGVisualData
78K Followers 159 Following Graphs, maps and data journalism from the Bloomberg Graphics team.
GFX Teens @bizweekgraphics
5K Followers 324 Following Beeps and boops from the world’s most goth graphics desk. Positive vibes only.

Amanda Shendruk @AShendruk
3K Followers 2K Following Code, data, design and journalism • Opinions graphics reporter at @washingtonpost @PostOpinions
Carlos Scheidegger @scheidegger
3K Followers 621 Following building @quarto_pub at @posit_pbc (the company formerly known as RStudio) he/him @[email protected]
Rob Simmon @rsimmon
9K Followers 2K Following Data visualization, cartography, & remote sensing. Ex @Planet & @NASAEarth. Blue Marble, Earth at Night, color. https://t.co/BDzRqYMing

Guardian Visuals @GuardianVisuals
29K Followers 782 Following Explaining the news when words aren't enough
Pitch Interactive @pitchinc
2K Followers 286 Following We are a multi-faceted data visualization studio focused on building meaningful experiences with data.
Daniel P. Huffman @pinakographos
11K Followers 84 Following An arboreal, poly, gender non-participant mapmaker. You can support my art & teaching at https://t.co/FzQRVe3aY8. Also: https://t.co/i6qDLfbARo & @AlphaCentQuotes.
Martin Elmer @MapHugger
838 Followers 296 Following M.S. Cartography alum, University of Wisconsin. I talk about infovis, map aesthetics, and alt cartography. | http://t.co/aN85G3ueFe
.. @WTFViz x.com/jburnmurdoch/s…

#DataViz idiom: "putting the chart before the horse" When u try to force the story into a chart type u rly want to use, & it diminishes both

Denne er direkte til @WTFViz. Figur, der viser data-tilgængelighed for EU-stater klimainvesteringer. Wow. trinomics.eu/climatefinance…

This is, uh, a pie chart. /cc @WTFViz x.com/wef/status/905…

The more years you spend in a classroom the lower your risk of heart disease wef.ch/2f39c58


Big dark blue passenger- big yellow passenger = small blue passenger. Paging @WTFViz


@Scribblr_42 @WTFViz @doidgyno9 I'd ditch the halves, rotate it through 90 degrees so the names straighten out, and probably replace the bars with 🏆🏆🏆

@WTFViz One for you, perhaps... x.com/bdstanley/stat…

"Get me the guy who does graphs for the Lib Dems." "He says there are limits to what he can..." "PAY HIM DOUBLE."


Fabulous! You should send it to @WTFViz for the award of the worst #dataviz of the month... x.com/albertocairo/s…

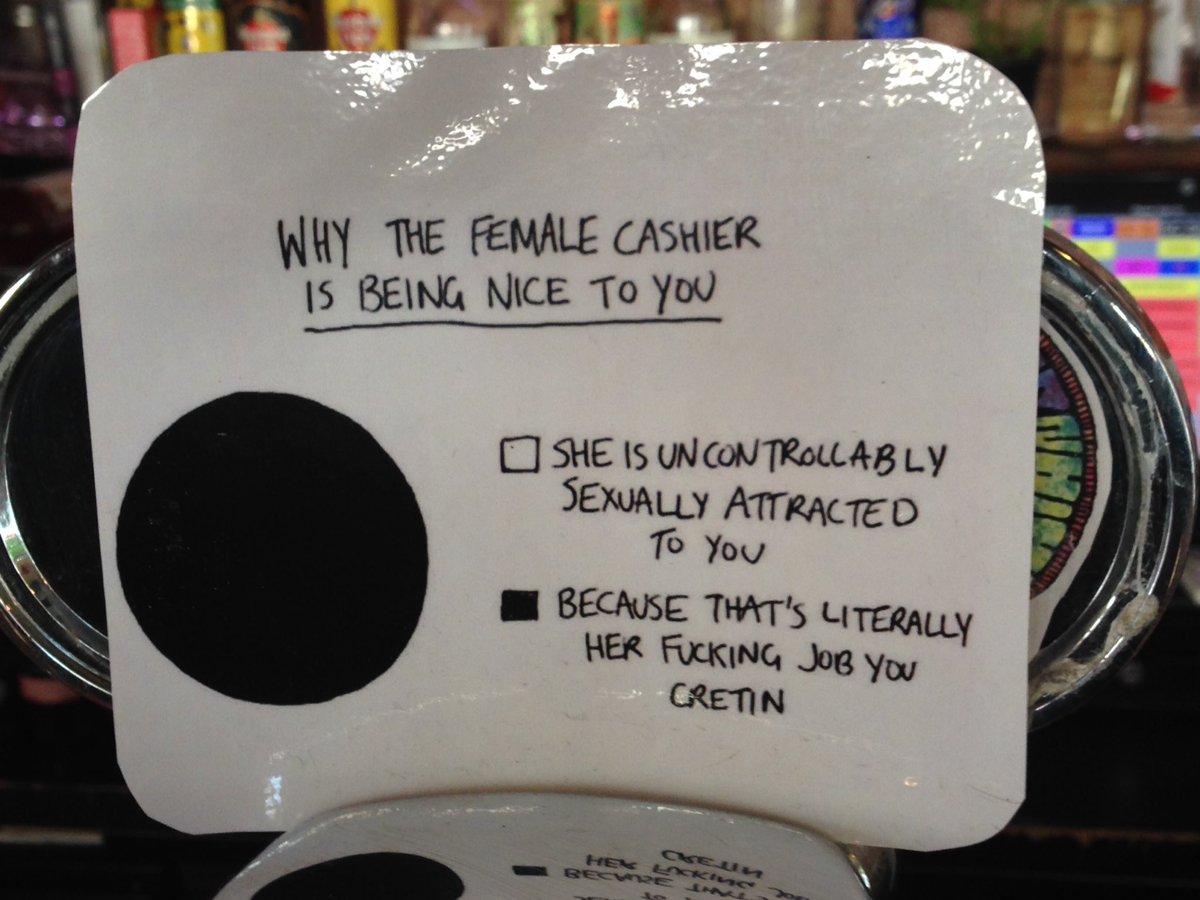
Chart rarities #23: A useful and pedagogical pie chart. ;-) Sad that its message is needed. :-( #dataviz @WTFViz #gender #piechart x.com/beercellarexe/…

This is definitely our favourite sign in the bar. Also if dudes could stop trying to kiss our female bartender's hands that would be great.

holy hell. @WTFViz x.com/mikevizneros/s…

@sib313 @DataRemixed @StatHunting The Post weighs in today with a solution that's worse in pretty much every way. washingtonpost.com/news/politics/…


@WTFViz It exists: cestlavis.github.io

@WayToGoPaul There is already @WTFViz they do ok here

Is there a twitter account devoted to people misunderstanding their own graphs? (it would be a great companion to @WTFViz )
Actually it is a rubbish infographic. Little graphic. Unrelated and unclear factoids. @WTFViz x.com/getsafeonline/…

Great infographic from @NCA_UK & @ukhomeoffice on the importance of reporting suspected money laundering.


@conradhackett @WTFViz Yes but if you need to look at labels to read a viz, then the visualization is not doing it's job.
2016 WINNER Community Awards silver: WTFViz by Drew Skau @WTFViz bit.ly/2eUeDRG #iibawards

Trends for United States
You might like