
PnLzero @PnLzero
In crypto since 2017 | Alpha Research | Airdrops 🪂 | Trading t.me/+illZsSOCfGQ1N… Access to alpha here 👉 Joined April 2023-
Tweets5K
-
Followers528
-
Following64
-
Likes3K
$ZEC keeps proving one thing: buyers are defending the same zone again and again. While most altcoins continue searching for support, $ZEC has already found one. And it’s a level the market has respected multiple times. The $280-$370 area isn’t just another demand zone. It’s where some of the strongest buying reactions on the entire chart have appeared. Every major pullback into this range has attracted aggressive buyers. Every rejection below it has been short-lived. That’s not random. It’s accumulation. What’s even more interesting is that price is now printing higher lows while holding above this support region. Momentum is slowly shifting in favor of the bulls. The longer a market spends building a base, the more explosive the eventual move tends to be. And after years of consolidation, $ZEC is sitting on one of the cleanest structures in the privacy coin sector. The market doesn’t need a new narrative. It already has one. Strong support. Consistent buyer pressure. And a chart that’s beginning to look ready for expansion. If this accumulation range continues to hold, the next major move could catch a lot of traders off guard.

What if $TEL has already printed its cycle bottom? Not many charts look as compressed as $TEL right now For nearly five years, price has been grinding lower respecting a massive descending trendline that started at the 2021 peak around $0.065 Every rally failed Every breakout attempt got sold Until now The interesting part isn’t the target It’s where price currently sits $TEL is trading near the exact area where sellers have historically run out of momentum After years of decline, volatility has collapsed, downside expansion has slowed and the chart is pressing directly against long-term resistance. That’s usually how major reversals begin Not with excitement With boredom A confirmed breakout above this multi-year structure would completely change the market narrative And if history decides to reward patience? The previous cycle high near $0.065 becomes the obvious magnet From current levels, that’s a move most traders would call impossible today Which is usually how the best setups look before they happen

$RENDER is back at a level where previous cycles found buyers Most traders are focused on the AI narrative The chart is showing something even more important: price is reclaiming strength after a prolonged correction On the monthly timeframe, three major liquidity zones stand out: Target 1: ~$5.0-5.5 Target 2: ~$8.2-9.0 Target 3: ~$13.0-14.0 Current price is still trading below all three That means the market hasn’t even begun testing the major supply areas from the last cycle What’s interesting is how clean the structure looks After topping near double digits, $RENDER spent more than a year correcting cooling off sentiment, and shaking out late buyers Now price is attempting to build a new base above the cycle lows If momentum continues to return, the first objective is reclaiming the $5 zone Above that, the chart opens toward $8-9, where the next significant liquidity cluster sits And if the broader market remains favorable a move back into the $13-14 region becomes a realistic discussion rather than a fantasy The crowd is still comparing today’s price to the highs I’m watching how much upside remains before the chart encounters major resistance again $RENDER looks like one of the cleaner recovery structures among large-cap AI plays

$DASH has spent nearly four years building a base Most traders see a dead chart I see a market that’s been compressing beneath the same long-term breakout level for an entire cycle The level that matters sits around $170 That’s where the multi-year trendline intersects with the first major resistance zone A breakout there wouldn’t just be another rally It would mark the end of a downtrend that’s been in place since the 2021 peak And once a market escapes a structure that old, moves tend to happen much faster than people expect The first breakout gets attention The next leg creates believers The real move catches everyone who waited for confirmation $DASH is still trading near cycle lows The chart won’t stay boring forever

$CHZ might be one of the most FORGOTTEN charts in crypto right now And that’s exactly why I’m paying attention For nearly 4 years, price has done nothing but make lower highs and lower lows Every rally failed Every breakout got sold Every bounce turned into another leg down Now look where we are Right back at the area where sellers are running out of room The entire downtrend from the 2021 cycle top has compressed into one massive structure Price is sitting at historical lows while the descending resistance that has controlled the chart for years is approaching its endpoint That’s where trends die And new ones begin Most traders see a dead coin I see a market that’s already gone through euphoria, distribution, capitulation, and years of apathy The interesting part comes after that A confirmed breakout from a multi-year structure doesn’t just attract traders It attracts attention And attention is what drives the biggest moves The risk is obvious The upside is sitting all the way back near the previous cycle highs That’s why charts like this deserve a watchlist spot before they deserve headlines

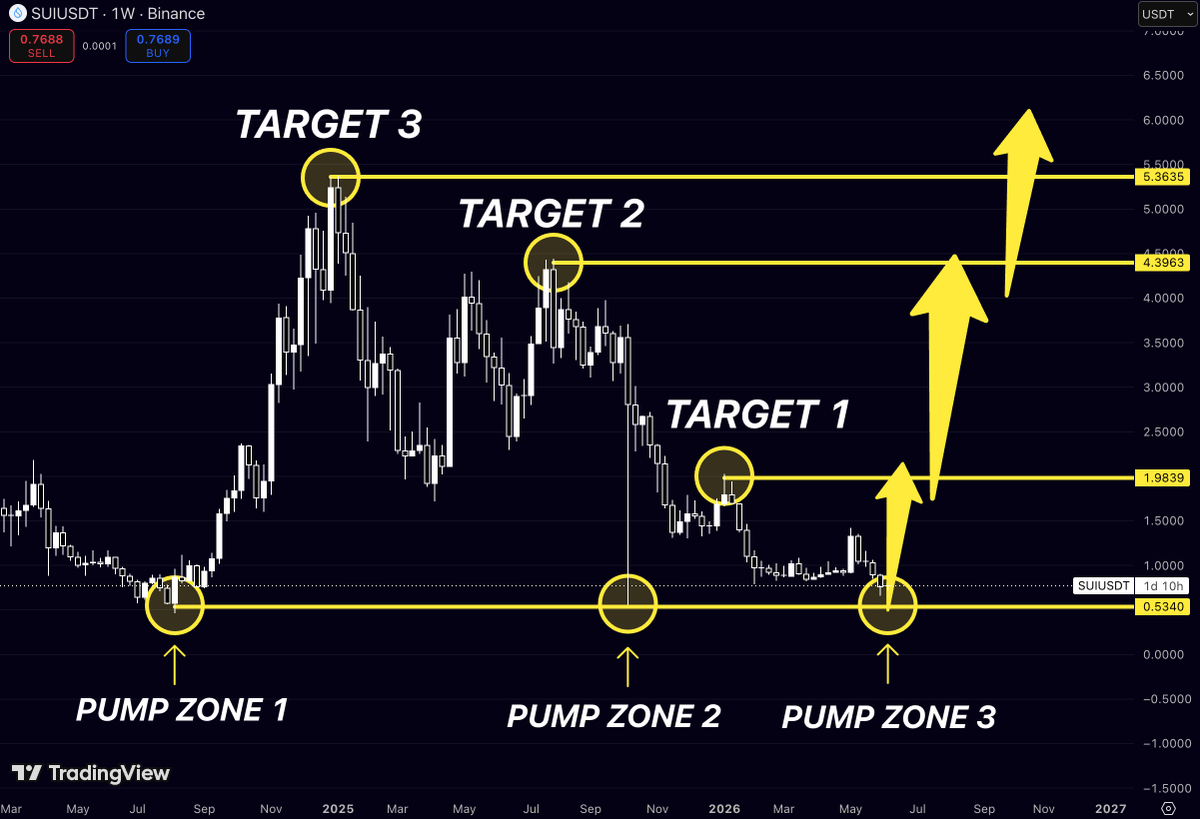
$SUI has now tested the same zone for the third time And every major rally on the chart started from it Look closely: 🟡 Pump Zone #1 → launch to ~$5.3 🟡 Pump Zone #2 → launch to ~$4.4 🟡 Pump Zone #3 → price is back at the exact area where buyers previously stepped in That’s not a random support That’s where demand has consistently overwhelmed sellers The market has spent months correcting from the 2025 highs, but the structure is starting to look familiar again If this floor holds, the roadmap becomes pretty obvious: 📍 Target 1: $1.98 📍 Target 2: $4.39 📍 Target 3: $5.36 What’s interesting is that each target lines up with a major rejection point from previous cycles Those are the levels that trapped buyers on the way down Now they become magnets on the way back up Most traders are focused on what’s happened over the last few months I’m looking at where every major $SUI rally has started And right now, price is sitting in that zone again
$NEAR is quietly doing something most charts never get the chance to do It’s building a base directly above the level that marked the cycle lows 🟡 Support: $1.88 🟡 Key Level: $6.23 🟡 Final Target: $8.22 Right now the market is focused on every small move around $2 The bigger picture is much more interesting For almost a year, $NEAR has been absorbing sellers around the same region while volatility keeps compressing That’s usually where trends are born The moment price starts pushing away from support, attention shifts fast First traders notice Then CT notices Then everyone suddenly starts posting the same chart $6.23 is the first level that really matters Above that, the conversation changes completely And if $NEAR ever starts trading back around $8+, nobody will be talking about whether $2 was a good entry They’ll be asking why they ignored it

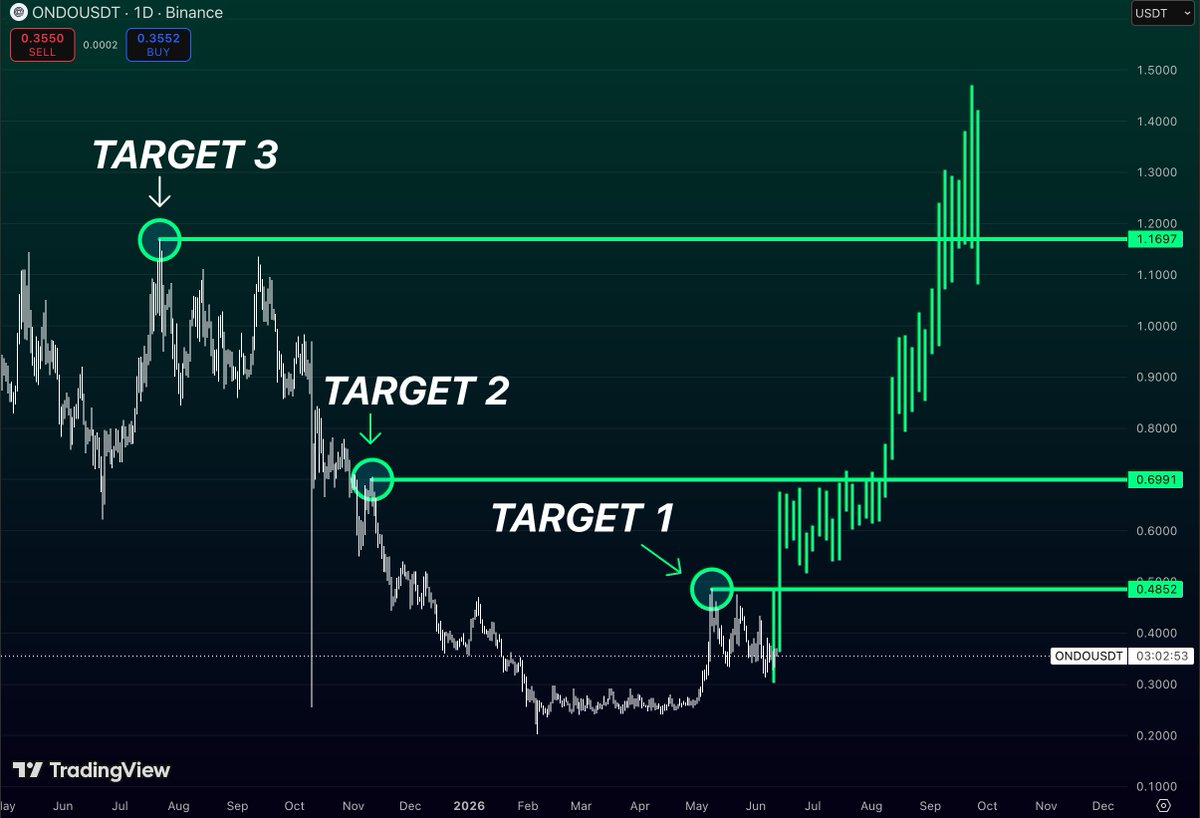
$ONDO is still sitting before the real move. No targets hit yet. No clean reclaim yet. But that’s exactly why the chart is interesting. Price is still trading near the lower part of the structure, while the main levels above remain completely untouched: 🎯 $0.48 - first major resistance 🎯 $0.69 - key breakout zone 🎯 $1.17 - macro target The green path is the scenario, not the current move. And that’s the point. Most traders only start paying attention after the first big candle. But the best setups usually appear before the chart starts looking obvious. $ONDO has already built the base. Now it’s about whether buyers can start taking back these levels one by one. If that happens, the whole conversation around $ONDO changes fast.
$WLD is sitting where most traders stopped paying attention The chart is still trading near cycle lows while the major supply zones remain untouched: 🎯 $2.16 - first key resistance 🎯 $4.17 - major breakout zone 🎯 $11.93 - cycle target What’s interesting is that every one of these levels comes from previous market structure, not arbitrary projections Right now, the market is pricing $WLD closer to its fear phase than its adoption phase A move back to the first target would already represent a significant expansion from current levels Reclaiming $2.16 would likely put $4+ into play, and above that, the chart opens up fast Most traders will only become interested after the breakout The opportunity is usually before the crowd notices it $WLD remains one of the more asymmetric setups on the board

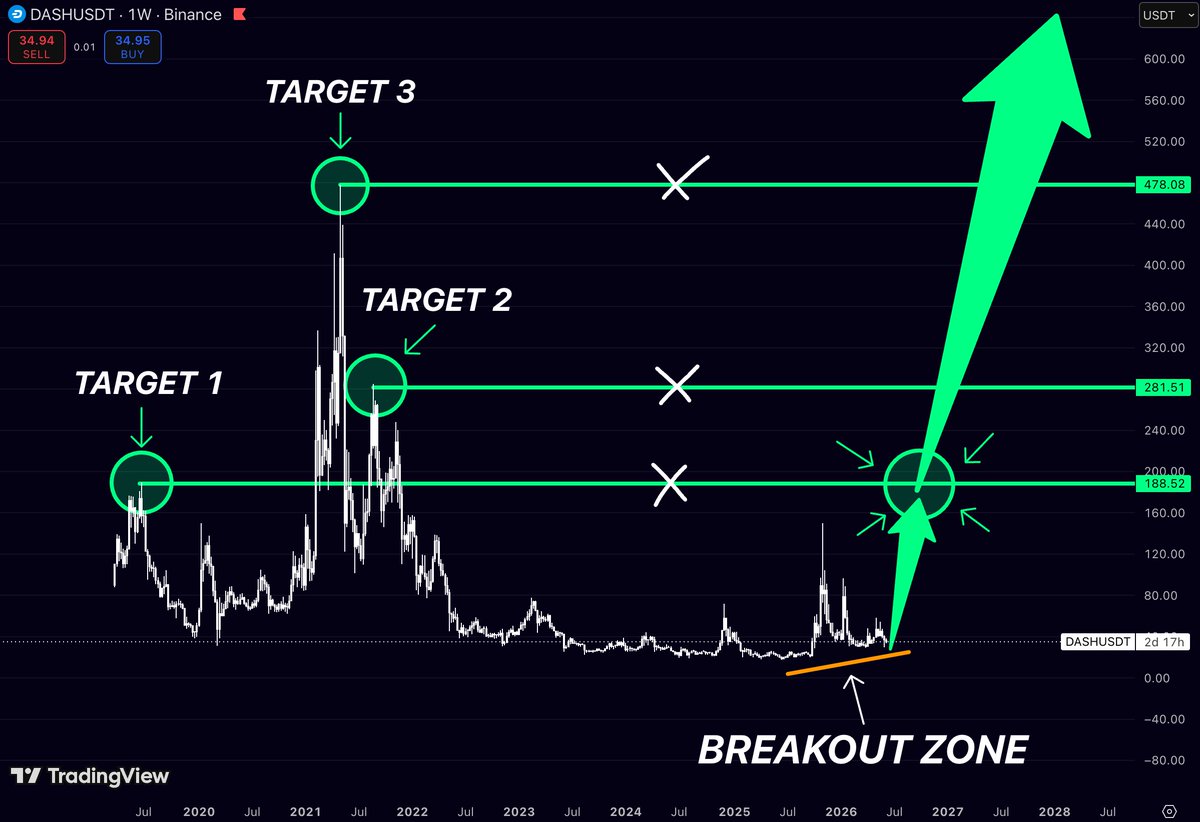
$DASH might be one of the most overlooked charts in the market right now After years of grinding near the lows price is pressing against a long-term breakout zone that previously acted as a major turning point The key levels on the chart are clear: 🎯 $188 - major historical resistance 🎯 $281 - next macro target 🎯 $478 - cycle high target What’s interesting is that $DASH is still trading massively below its previous cycle highs despite spending years building a base A clean move through the $188 region would completely change the market structure and open the door for a much larger expansion The longer an asset consolidates near the bottom, the more violent the breakout tends to be $DASH looks like a classic compression-to-expansion setup
$WLD still looks like one of the most asymmetric setups in the market After a brutal drawdown from the launch highs price has spent years grinding lower and flushing out almost everyone who bought the narrative Now the chart is sitting near historical lows while several major levels remain untouched above: 📍 $2.12 - critical level 📍 $4.18 - major breakout zone 📍 $11.94 - macro target What’s interesting is that every previous rally stalled around these exact areas That’s why they matter The market doesn’t need new highs tomorrow It only needs to start reclaiming old territory And if $WLD starts taking back levels one by one the upside becomes a lot larger than most people currently expect

$TAO doesn’t need a new ATH to make a lot of people rich. It just needs to revisit levels it has already traded at before. The chart is pretty straightforward: 📍 $385 - first major resistance 📍 $750 - previous distribution zone 📍 $1,250 - cycle target What’s interesting is where price sits today After months of chopping around and shaking out both bulls and bears $TAO is still holding far below levels that were accepted by the market multiple times during the last cycle. Most traders are focused on the next 10-20%. I’m looking at the bigger picture. A move back to $385 is one thing. A move back to $750 changes the entire narrative. And if AI remains one of the strongest sectors this cycle, the market will eventually start asking whether $1,250 is really that far away. $TAO remains one of the charts I’m watching closely

$NEAR looks even better on this version of the chart The setup isn’t about reclaiming old highs It’s about breaking a multi-year downtrend that’s been suppressing every rally since 2024 📍 The breakout zone sits around $5-6 That’s where the descending resistance intersects with current price action And here’s why it’s interesting: Every major $NEAR rally over the last two years died at a lower high Sellers kept stepping in earlier and earlier Now price is approaching the exact point where that structure finally breaks Once that trendline is gone, the chart becomes surprisingly empty The next major historical level isn’t $8 It isn’t $10 It’s the old cycle supply zone near $20.5 That’s what makes this setup attractive You’re not looking at a coin trying to recover from a local correction You’re looking at a chart attempting to end a multi-year bearish structure Most traders will wait for confirmation The market usually doesn’t reward that By the time everyone agrees the trend is broken $NEAR is often already trading multiples above the breakout level The chart spent two years compressing volatility Those periods tend to be followed by expansion And if that orange trendline finally gives way $20 stops looking like a moonboy target and starts looking like the next major liquidity magnet

$TIA is one of those charts that looks completely dead until you zoom out From the 2024 highs, it has done nothing but bleed lower Every bounce got sold Every recovery attempt failed Now look where price sits Right at the area where nobody wants it anymore That’s usually when things get interesting The chart is basically mapping out three major levels the market respected on the way down: 🎯 $9.3 🎯 $11.9 🎯 $21.3 And here’s what stands out to me: Those aren’t random targets They’re former support zones that eventually turned into resistance as the trend collapsed If $TIA ever starts reclaiming those levels, the narrative changes fast First people call it a dead-cat bounce Then it reaches $9 and everyone starts checking the chart again Above $12, sidelined money begins chasing And if $21 gets reclaimed, you’re looking at a completely different market structure than the one we’ve had for the past year The biggest mistake traders make is assuming a chart that fell 90% can’t become a leader again History says the opposite Some of the strongest performers of every cycle are the coins that spent the longest time being ignored $TIA doesn’t need a miracle It just needs buyers to start taking back old territory one level at a time And from current levels, that’s a lot of territory

$RENDER keeps doing something very few charts can claim It keeps printing higher cycle highs Look at the timing ATH 1 ➜ ATH 2 took roughly 122 days Now we’re sitting about 122 days from the last major cycle low again Coincidence? Maybe But markets love repeating structures until they don’t What’s even more interesting is that $RENDER isn’t trying to recover old highs from years ago Its previous cycle high sits around the $14 zone A new all-time high would put it near $21 That’s another ~14x move from current prices Most traders spend their time hunting for the next narrative $RENDER is already one of the strongest AI charts in the market If the AI sector gets another major rotation, this is exactly the type of chart that can start moving much faster than people expect

$CHZ HAS BEEN DEAD FOR YEARS That’s exactly why this chart is interesting Most people only remember the 2021 hype What they don’t see is that $CHZ has spent almost 4 years bleeding lower, building one of the longest accumulation structures in the market Now compare where price sits today to the major rejection levels that defined the entire downtrend The first meaningful target is around $0.14 Above that sits $0.29 And if a full altseason rotation returns, the final major level from the previous cycle comes in near $0.65 From current prices, that’s roughly: Target 1 → +400% Target 2 → +900% Target 3 → +2200% Nobody cares about $CHZ right now That’s usually when the best risk/reward setups start forming

$ZEC is one of those charts that nobody wants to talk about until it’s already gone Everyone is focused on the recent rally but the real story is the structure For months, $300 acted as the floor Price revisited it, reacted exactly where it should, and launched Now there’s only one major level left above The 2021 cycle high around $750 That’s nearly 70% higher from here What’s interesting is that $ZEC isn’t trying to reclaim old resistance anymore It already did that The market spent months building a base above support absorbed supply, and is now trading in the middle of a historical vacuum with very little structure overhead If momentum continues, the path toward the previous cycle high is surprisingly clean $300 was the test $750 is the target

$TEL is trading 96% below its all-time high Most people see a dead chart I see three levels that have controlled every major move for the last five years The first sits at $0.012 The second at $0.036 The final one is the all-time high around $0.065 None of them have been reclaimed yet That’s the point When an asset spends years building a base near cycle lows the biggest percentage moves happen before most investors start paying attention Right now, $TEL is still trading beneath every major historical resistance If buyers can reclaim the first level, the chart opens toward the second If the second falls, the market starts looking at the ATH again The roadmap is simple The execution is not

$NEAR has already shown you every level that matters. The market just forgot. Three monthly levels have controlled nearly every major turning point in $NEAR history: $3.3 - the level that capped the first major bounce after the bear market began $9 - the major distribution zone from 2024 $20 - the area where the 2021 mania topped out before the collapse Right now, price is sitting below all of them. Nothing has been reclaimed. Nothing has been confirmed. But that’s exactly what makes this chart interesting. The entire structure is built around one simple idea: If $3.3 flips from resistance into support, the next major liquidity pool sits around $9. If $9 gets reclaimed on the monthly timeframe, the chart opens into a large air pocket with very little historical resistance until the $20 region. And that $20 level isn’t random. It’s where the biggest concentration of trapped supply from the previous cycle exists. Most traders will only become interested after those levels are already reclaimed. The opportunity exists before that happens. The market spent years compressing after a 90%+ drawdown. Now it’s approaching the first level that can change the entire higher-timeframe structure. Watch $3.3. Everything starts there.

$WLD is one level away from proving the entire market got it wrong Most traders see a coin that’s already pumped I see a chart sitting directly under the level that separates a dead rally from a new cycle The entire structure revolves around three historical zones: $4.15 - the first major rejection level from late 2024 $6.50 - the level that triggered the collapse after the first distribution phase $11.98 - the all-time-high supply zone What’s different this time? Price didn’t just bounce It went from under $1 to nearly $12 in a single expansion and is now spending months building acceptance directly beneath the ATH level That’s not what weak markets do Weak markets get rejected immediately Strong markets absorb supply And that’s exactly what $WLD has been doing around $10-$12. If buyers can turn the ATH zone into support, the market enters price discovery The biggest moves don’t start after new highs are printed They start while everyone is still debating whether the breakout will fail $WLD looks closer to that moment than most people realize


NS @NS2008168
8 Followers 39 Following
GaVaChain @gavachain
198 Followers 699 Following
Jade @CvzYesim
388 Followers 2K Following Animal Lover, #satınalmasahiplen RT ler ve Fav lar onay anlamına gelmez.


Divina Justicia @DivinaJusticia6
141 Followers 1K Following
Araz @Sajjad22200
80 Followers 205 Following
Ozan Yazıcı @bmbcimlym
0 Followers 79 Following
Horpheyemi @Horpheyemi3553
115 Followers 578 Following

احمد# الثال�... @xxvbnm372
628 Followers 1K Following
XÐ @xd042069
750 Followers 1K Following Grok/xAI updates • Elon Musk decoded • AI tech (Linux/local models) • $DOGE/X Money vibes | Daily insights & translations 🤖💰 #Grok #xAI #Crypto
MarketHawk @MarketHawk_Pro
0 Followers 31 Following
Muzaffer Tosyalıoğl... @muzo64_oglu
235 Followers 917 Following
Antoine | Trade in Pu... @Anto_QuantikLab
7K Followers 33 Following Building trading strategies and documenting my track record in public🔬 Focused on risk management, consistency and long-term performance 📈 Follow my journey👇
bayram yücel @bayramy04047631
69 Followers 406 Following

寝ても覚めても @VWr5NzvEpXc5Bov
2 Followers 254 Following
深蓝 @shenlan1999
55 Followers 676 Following
차영민 @espreesomin
3 Followers 33 Following
Nik Tavcar @nik_tavcar
19 Followers 31 Following
Born-again Bruin ✝�... @TheReturningSon
99 Followers 376 Following Attorney by day, Christ follower and Bruin fan every day. The harvest is plentiful, but the laborers are few. -Luke 10:2
Karthik mariyappan @karthikeyan5193
285 Followers 1K Following
NFTcryptoART @_NFTcryptoART
147 Followers 237 Following Alpha 🔎 Airdrops 🪂 Markets 📈 🏀#Web3Gaming_ ☄️
Leon @leonazh19
318 Followers 1K Following Small business funding provider #bitcoin 🛡 #Zcash 🇺🇸🇮🇱❤️NY

. @bolehaja12345
10 Followers 28 Following
MAGA Never Dies @mjauble
1K Followers 4K Following
Farshad Ra @ra_farshad10403
50 Followers 162 Following

Alem @Avi72947845
0 Followers 180 Following

Minh Vương @mvuong1010
697 Followers 968 Following

صدام المانع @AlmanSdam80223
47 Followers 112 Following
🇹🇷ACAR YAZICI T... @acar3437
147 Followers 878 Following
rakib @rakib0936
17 Followers 186 Following
Nguyen Nguyen @ChiNguyen131
57 Followers 373 Following
Slow_n_Steady @seams5s
332 Followers 1K Following
A.H. @Aha_CA
90 Followers 522 Following

lolo @lolo713333
355 Followers 1K Following Discovered $ALGO in 2019. still love and support it. Biggest fan of 🛡️ $zec zcash $near $hype
박정우 🇰🇷-�... @openhouse333
2K Followers 3K Following HOKKAIDO TOKAI UNIVERSITY 졸업 / 로고, 심볼 디자이너 / 블로그 관리대행 / 변화에 한발 앞서 대응하고 주도적으로 길을 개척한다.


ETHGAS @ETHGasOfficial
339K Followers 92 Following The Realtime primitive that accelerates Ethereum over 100x
Polymarket @Polymarket
1.6M Followers 6K Following The World's Largest Prediction Market. Trade politics, news, crypto, culture, sports, tech, & more. Discord: https://t.co/tzKrbDfF3x
CoinDesk @CoinDesk
3.7M Followers 2K Following Leading the conversation on accelerating crypto’s future. Follow @CoinDeskPodcast @consensus2026 @Consensus_HK @CoinDeskES @CoinDeskMarkets @CoinDeskData
Ted @TedPillows
306K Followers 17K Following Survived 2 cycles, still here turning on-chain and macro economics signals into trades.
Investing.com @Investingcom
1.5M Followers 321 Following https://t.co/gPm7AlQtSR helps 50 million investors find trades others can't. Get AI-picked stocks, chart analysis, Fair Value, and breaking news in 33 languages.
Michael Saylor @saylor
5.1M Followers 817 Following Bitcoin is https://t.co/KbbYe74DgB | $BTC Hodler | @Strategy Founder & Chairman | bio https://t.co/9Zlq0oHYnP | free education https://t.co/4L1s0ix7FE | $MSTR $STRC
Cointelegraph @Cointelegraph
2.9M Followers 2K Following Trusted crypto media since 2013 · News, research, podcasts & more · Explore: https://t.co/6IsiPge7RR
Crypto King👑💎 @cryptosanthoshK
127K Followers 1K Following Don't get scammed | DM = partnerships | legit handles of mine below 👇|🦅
Bitcoin.com News @BitcoinNews
3.3M Followers 1K Following Get Bitcoin, crypto, and economics news in 25+ languages. Follow @bitcoincom for updates, join us on TG: https://t.co/2pY59RGHhk. Ads: [email protected].
Vivek Sen @Vivek4real_
261K Followers 963 Following Covering crypto and AI • Founder @TrendingBitcoin • Prev @BitcoinMagazine
Bitcoin Magazine @BitcoinMagazine
4.2M Followers 1K Following The Most Trusted Voice In #Bitcoin 🟠 • Find us https://t.co/X4mXn4g3Oo
Wu Blockchain @WuBlockchain
557K Followers 407 Following Important Crypto News mainly Asia Lead by Colin Wu 吴说 More Channels: https://t.co/EWW3fUtX5v Contact: Tele colinwu1989 non-financial advice
CZ 🔶 BNB @cz_binance
11.5M Followers 1K Following Buy the book (proceeds go to charity): English: https://t.co/UxgYxYJ3NF Chinese: https://t.co/ItFd8FEyuK @binance @BNBchain @YZiLabs @GiggleAcademy
Meme_Joey 🚀🚀�... @Mr_CryptoJoey
2K Followers 3K Following All in #Crypto #Meme we trust, hold we must! #BTC, Growth Lead of #Bitunix. Previously Growth Director of #Bitget @theNovaStrategy
Midas @DeFiMidas
99K Followers 255 Following 𝔸𝕚𝕣𝕕𝕣𝕠𝕡 𝕒𝕟𝕕 𝔻𝕖𝔽𝕚 𝕥𝕙𝕣𝕖𝕒𝕕𝕠𝕠𝕠𝕣 🧵 𝕪𝕠𝕦𝕣 𝕘𝕦𝕚𝕕𝕖 𝕚𝕟 𝕨𝕠𝕣𝕝𝕕 𝕠𝕗 𝕎𝔼𝔹𝟛 𝕒𝕟𝕕 𝔻𝕖𝔽𝕚
BloFin Exchange @BloFin_Official
121K Followers 387 Following Where whales are made. | #BloFin offers premium perps & futures #trading with over 500+ USDT-M trading pairs | @BloFin_Listing for updates.
Atlas @crptAtlas
78K Followers 96 Following When Crypto feels like a storm, I'll be your lighthouse Daily crypto educational content and my moves 7 years in space for business: https://t.co/QjnuFVXDPC

Oracle Boar @bored2boar
25K Followers 555 Following 𝗢𝗻-𝗖𝗵𝗮𝗶𝗻 𝗜𝗻𝘃𝗲𝘀𝘁𝗶𝗴𝗮𝘁𝗶𝗼𝗻𝘀 / 𝗣𝗿𝗲𝗱𝗶𝗰𝘁𝗶𝗼𝗻 𝗺𝗮𝗿𝗸𝗲𝘁𝘀 / 𝗗𝗲𝗙𝗶 𝗺𝗼𝘃𝗲𝘀

Daxak @0xDaxak
2K Followers 91 Following DeFi from Olympus ⟁ On-chain oracle ⟁ Sybil ash Clouds part when alpha drops I don't follow meta. I snipe it from the sky
NoName @WhaleNoName
46K Followers 505 Following Trader since 2018 | BTC · Stocks · DeFi · Degen · Macro Called BTC ATH 2025. Made 3M on TRUMP
RozeFi @DeFiRoze
5K Followers 156 Following Trader of #SOL #BSC #BRC #NFTs. Researcher. Alpha content🌹📜
Orbion @cryptorbion
16K Followers 57 Following Ex-BlackRock | Full-time crypto degen | Alpha researcher

DanteX @0xdantex
9K Followers 143 Following “FOMO is the enemy of wisdom” Philosopher of the 21st century | On-chain thinker | Decentralized mind


Wenaltseason? @wenaltseason
16K Followers 1K Following WenAltSeason Labs | @wenaltseasonlab | Masters of Virality, Alts and Marketing. We’ve worked with 417+ founders - if it went viral, we probably touched it.
IncomeSharks @IncomeSharks
743K Followers 2K Following Stock and crypto, analysis & predictions. Be careful of impersonators. Trades/education on Slice: https://t.co/HKRP4lGWFN.
Money Ape @TheMoneyApe
486K Followers 152 Following Trading Since 2016 | Altcoin Research & Portfolio Strategies | Building Crypto Research Tools | TG: https://t.co/Edi8hZslch

Ash Crypto @AshCrypto
2.2M Followers 351 Following News, Memes, Charts, Hopium, Market analysis and Latest crypto updates. Our official Telegram https://t.co/6iHJbN2D67
Monad @monad
1.2M Followers 251 Following Layer 1 blockchain bringing parallel execution to the EVM || 10,000 TPS || account by Monad Foundation || https://t.co/oM9xT93LGf

ᴛʀᴀᴄᴇʀ @DeFiTracer
403K Followers 917 Following On-chain 🔎 | Web3 Developer 💻 | Airdrops 🪂 | Trading
Tony Research @TonyResearch_
53K Followers 299 Following Trader & Investor | Defi Researcher | Holder $ETH
John @CryptoGodJohn
865K Followers 893 Following 👑 For first access to all my trades, onchain plays, and daily market insights signup to @wealthgroup 🔥 My posts are not financial advice @rainbetcom

Devchart 👨🏻�... @devchart
198K Followers 481 Following Swing Trader | Automation Guru | Meme Master |
𝗰𝘆𝗰𝗹𝗼�... @nobrainflip
566K Followers 475 Following Crypto trader & angel investor ✧ Follow for free educational content on crypto investing & trading All my channels and links: https://t.co/yWHZ7PLKvK
K A L E O @CryptoKaleo
727K Followers 2K Following καλέω: to call This is my journal Co-Founder - @LedgArt_io
Leviathan @TechLeviathan
39K Followers 203 Following Master of Blockchain development | Profiting in DeFi/Crypto | Follow for alpha threads And go from $100 to $100,000 with me! 🚀
Simba @Simba_crpt
26K Followers 118 Following Alpha researcher | Crypto Analytics | Web3 Developer | Not financial advice
rskl @rsklwtf
9K Followers 3K Following @monad (monad): contributor / validator @mopwtf (mop): founder prev: layerzero, sophon, iron fish: cm pi squared: ct lead
BredoStrategy @DoCryptoBred
1K Followers 820 Following Vault - https://t.co/EZLT76Vfpo tg - @DoCryptoBred BredoStrategySubs - https://t.co/TZCIRbxy4g
defigen @defigen
5K Followers 1K Following DeFi generation degeneration overinvested in shitcoins (by a lot)
FarmMyTears @FarmMyTears
601 Followers 158 Following Daily news + hidden alpha | Altseason insider 🔑
Skirk @0xSkirk
552 Followers 73 Following My name is Skirk, and I am the smartest girl in crypto. | Airdrop, DeFi, Stablecoin, InfoFi | Daily news + hidden alpha | Altseason insiderYou might like