Data Visualization Society @DataVizSociety
We are dedicated to fostering community for data visualization professionals. 📧 https://t.co/vImqO00uDF datavisualizationsociety.org Joined January 2019-
Tweets4K
-
Followers80K
-
Following352
-
Likes6K
Explore the process of creating data visualization badges for a community using flowers and numbers. Creating a local data art community with Natalia Kiseleva (@eolay13)! nightingaledvs.com/flowers-and-nu…
Meet Danne Woo, who recently joined as our Education Director. Get to know their career trajectory, favorite charts, and what inspires them. Read more: buff.ly/49APJkI

Today is the last day to register for #FutureFridays in May! Data Illustrator Sonja Kuijpers will be joining every Friday to help you discover how you can nudge users through emotive design. Full details on how to join here: infogr8.notion.site/Future-Fridays…

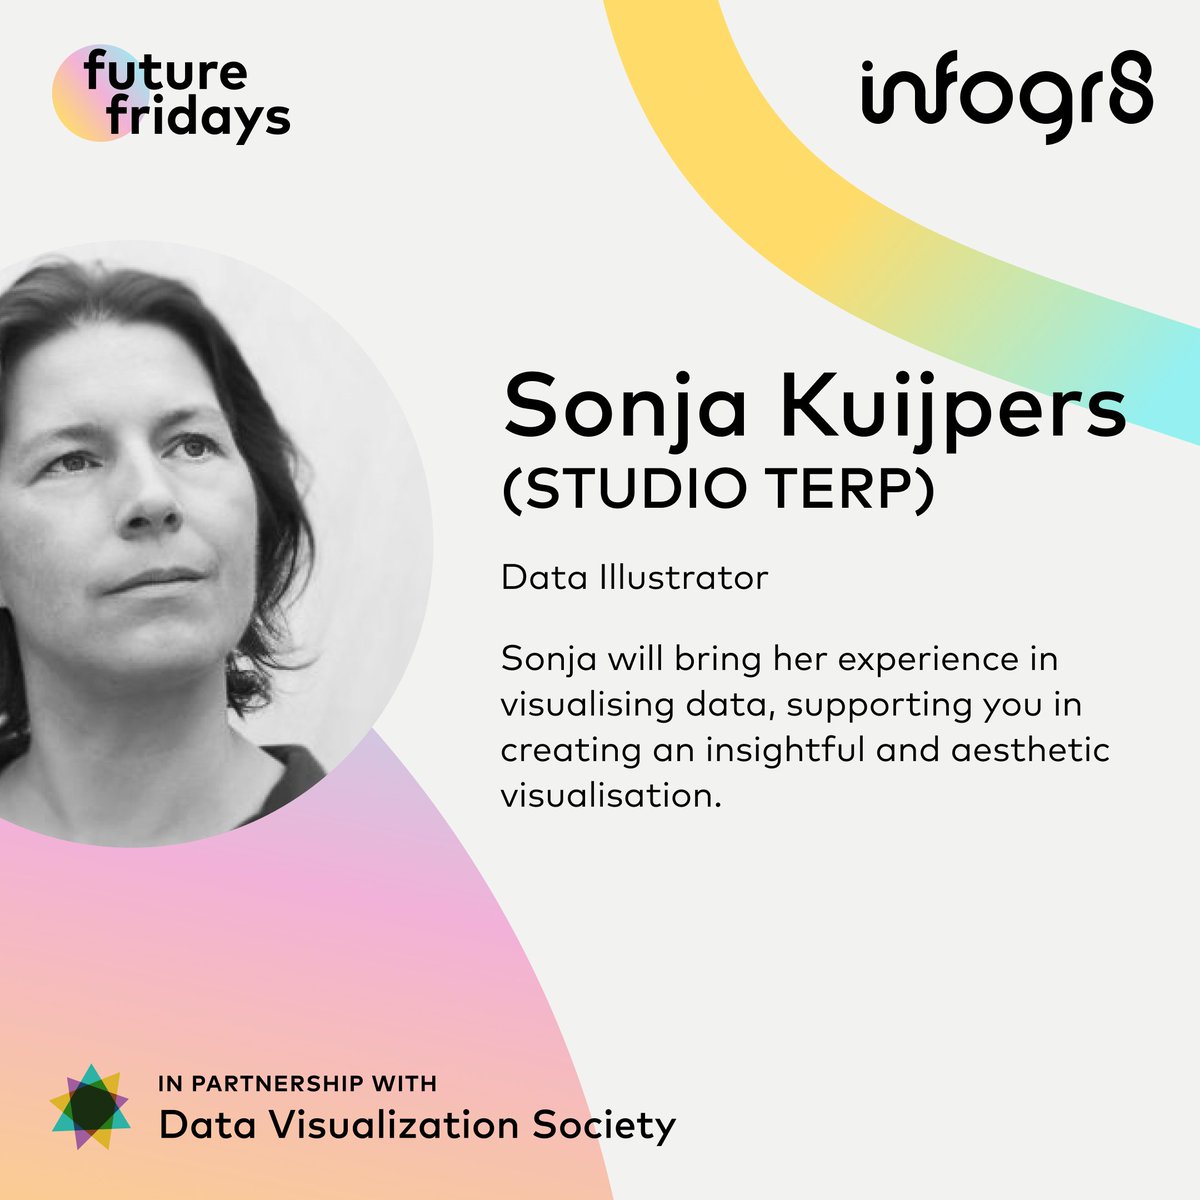

Sonja Kuijpers is joining Future Fridays in May to guide you through the use of emotion in #dataviz. The registration deadline has been extended to April 30. Full details on how to join here: infogr8.notion.site/Future-Fridays…

Joyeuse Journée internationale du graphique! 📊 Explorez les ventes par état avec notre carte remplie sur Excel et découvrez les tendances régionales en un coup d'œil! #ChartDay Link to the dashboard : lnkd.in/eFCvr456


Happy International #ChartDay! Today I'm re-sharing a favourite of mine which kick-started my @tableau #DataFam journey less than a year ago! This viz and technique was also featured in #wow2023 week 25, which was an honour. @DataVizSociety
Happy International #ChartDay! Today I'm re-sharing a favourite of mine which kick-started my @tableau #DataFam journey less than a year ago! This viz and technique was also featured in #wow2023 week 25, which was an honour. @DataVizSociety
Celebrating my first contribution to the International Chart Day 🕺🏼 Happy to be part of the game with my latest graph showing conflict trends vs peace agreements (data credits to @UCDP)

Celebrating my first contribution to the International Chart Day 🕺🏼 Happy to be part of the game with my latest graph showing conflict trends vs peace agreements (data credits to @UCDP) https://t.co/0x6j3PajaY


Happy International #ChartDay 🥳 @DataVizSociety Here is my visualisation of the US Treasury yield curve to celebrate the occasion 😁🩵✨ Made with @plotlygraphs


For #ChartDay I'm sharing a graph I made for a blog post a while back (seeinglogic.com/posts/livectf-…) comparing how two competitors approached a head-to-head speed hacking challenge. Making this graph pushed me to learn new things. Thanks for the push to share, @DataVizSociety .


Se ve que hoy es el día internacional de los gráficos, así que aquí va el último de la serie @DataVizSociety #ChartDay #ggplot2 Código: github.com/mikelmadina/pu…


It's International #ChartDay! This data art by myself visualizes scores for senior women (30+) athletes at the 2023 World Pole & Aerial Championships. See how finals compared to prelims! @DataVizSociety #bokeh #python #polesports #dataviz

Today is International #ChartDay, so in building off of yesterday’s post, we’re sharing one of our favorite charts created by JIL Data Visualization Engineer Jess Sorensen. This chart was included in our “Traffic stop policy in Ramsey County, MN” report: lnkd.in/e83PxY7W

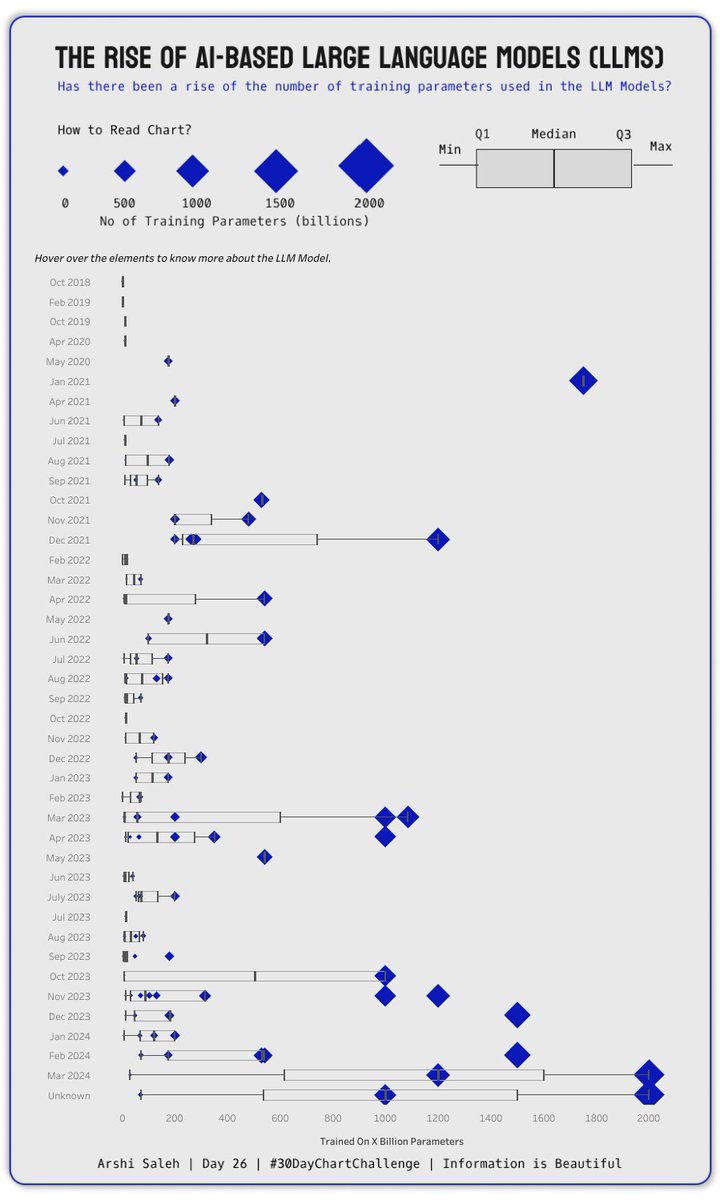
Hello #DataFam For #Day26 of #30DayChartChallenge the Prompt was #AI and I have explored "The rise of AI-based LLMs". Today is International #chartday and this is my contribution to celebrate the day. Sharing the #Tableau Link: public.tableau.com/views/30DayCha… @DataVizSociety

On this #ChartDay, a graph reveals more than data—it shows the persistence of #women in entrepreneurship despite a wide gender gap. While leadership roles plateau, female sole proprietors rise, charting paths around systemic barriers: wrld.bg/IuYl50QTxTY | @DataVizSociety
Happy #ChartDay, @DataVizSociety🎉 Celebrating the power of data visualization with a #Infra4Dev piece I created on Colombia's eco-friendly policy shifts. In '17 🇨🇴 reduced sales taxes on hybrid & electric vehicles & lowered import tariffs—visualizing policy impact beautifully!


@DataVizSociety For #ChartDay I want to share a #dataviz I made for #DuboisChallenge2024 📊 Really enjoyed learning about his work! 🔗: shorturl.at/hjrz7
@DataVizSociety For #ChartDay I want to share a #dataviz I made for #DuboisChallenge2024 📊 Really enjoyed learning about his work! 🔗: shorturl.at/hjrz7

@DataVizSociety Example I did years ago, duplicating a chart I built at work: stratification of sales $ & increase of sales YoY. While I think I could build something better now, I like the jitterplot for density comparison #ChartDay public.tableau.com/app/profile/as…

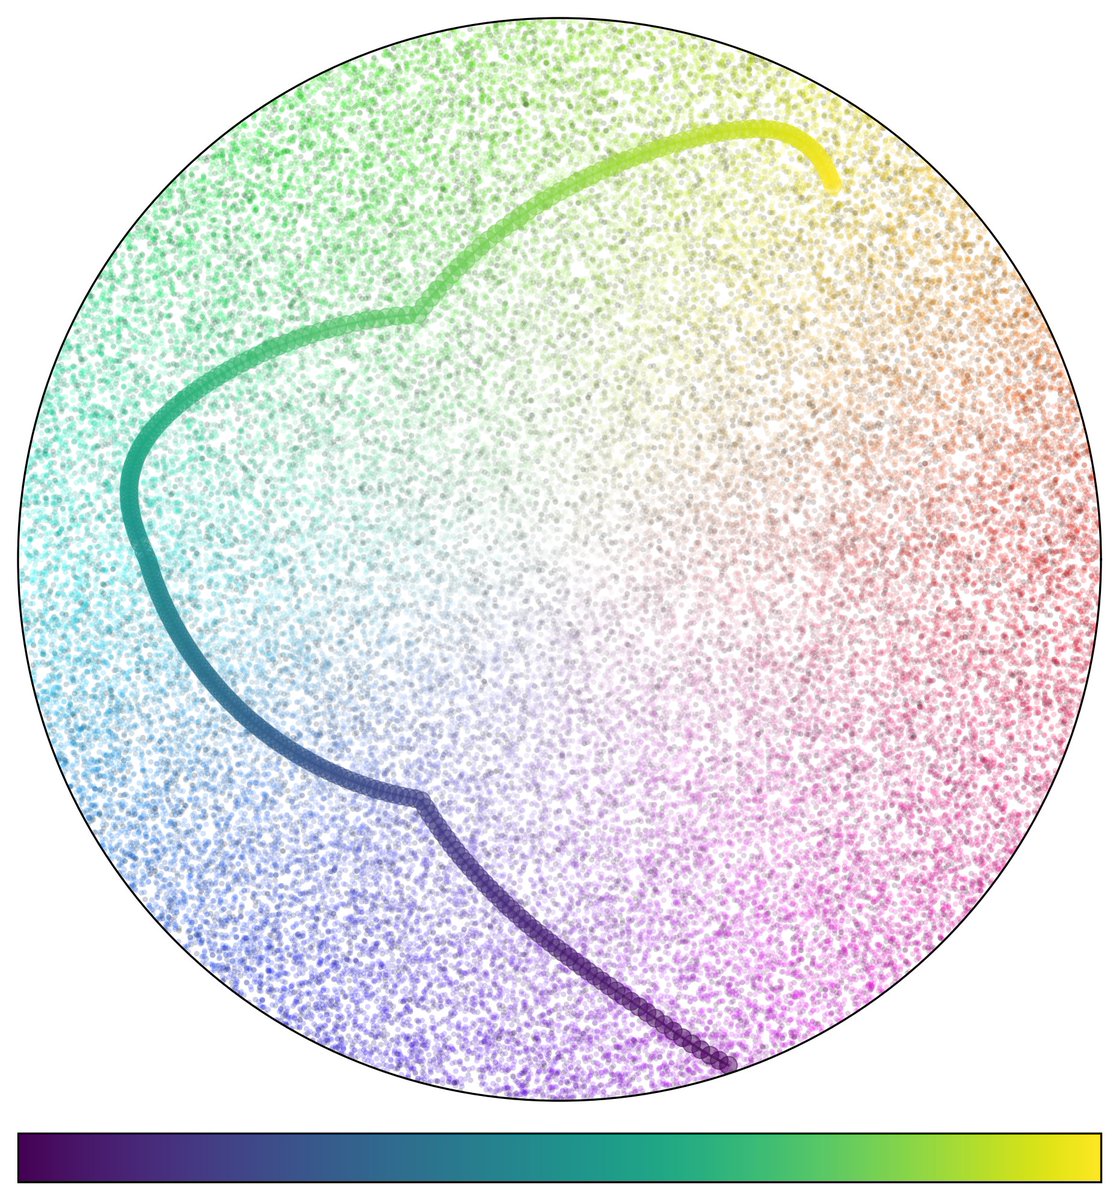
@matplotlib colormaps visualized as trajectories through 2D RGB space. Inferno, Viridis, Cool, HSV #ChartDay @DataVizSociety


Check out the scatter plot attached to my newest piece, where you can explore how housing affects school integration by changing housing metrics for the y axis and filtering by the share of students attending school in their own neighborhood. #ChartDay housingmatters.urban.org/feature/school…


Here are some of my charts for @rapplerdotcom. From politics to sports 📊🤓

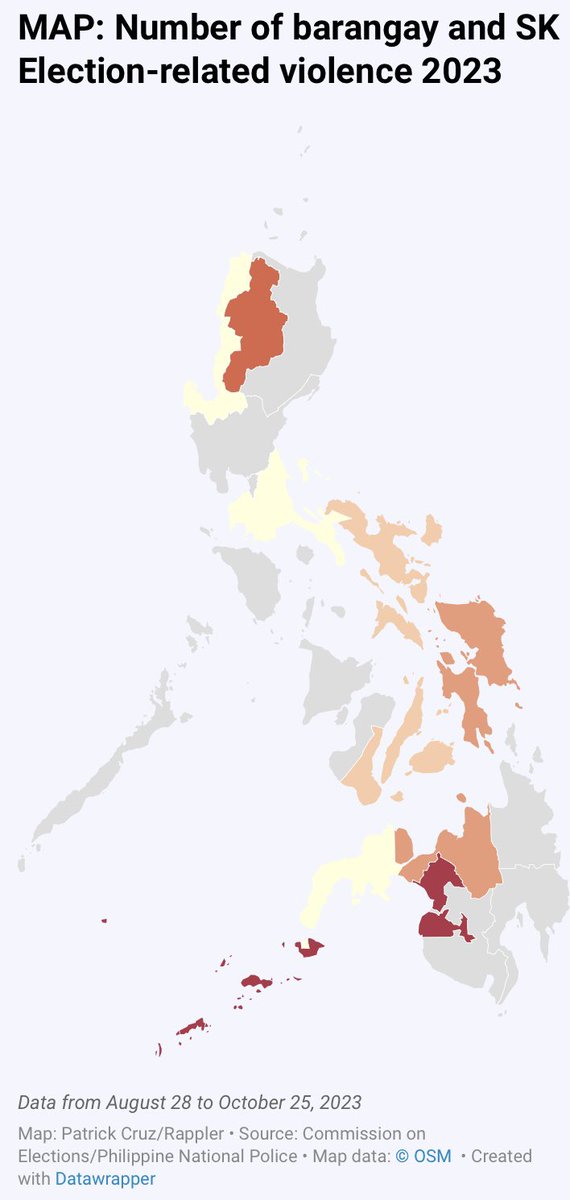


Here are some of my charts for @rapplerdotcom. From politics to sports 📊🤓 https://t.co/JtIWu1Y7Ye

Nadieh Bremer @NadiehBremer
48K Followers 579 Following Data Visualization Artist (+ graduated Astronomer ✨) with a love for Data & Generative Art | 🇳🇱 https://t.co/2QeuXCOGlo
Federica Fragapane @fedfragapane
20K Followers 1K Following Information designer based in Italy. Works in the Permanent Collection of MoMA 🔗 https://t.co/ggpM8XORDO
Alberto Cairo @AlbertoCairo
68K Followers 5K Following For news, follow me on BLUESKY: https://t.co/nN8zwUEmZs and LINKEDIN: https://t.co/BV7fInzN6w
Kevin Flerlage @FlerlageKev
16K Followers 3K Following Tableau Evangelist/Data Visualization Consultant at Moxy Analytics | 5X Tableau Visionary | 5X Tableau Public Ambassador | One Half of the Flerlage Twins
Tableau #Data24 @tableau
178K Followers 3K Following Tableau helps people see and understand data. We 💙 our #DataFam. Tableau Conference April 29-May 1 #Data24
Yan Holtz @R_Graph_Gallery
19K Followers 724 Following Software engineer who ❤️ #dataviz. Creator of https://t.co/sj29jZPkYr and the R, Python, D3 and React graph galleries. ➡️ https://t.co/PoJNeHXz8a 📈 🌊 🍺
Cédric Scherer @CedScherer
26K Followers 2K Following 🧙♂️✨📊 Independent #DataViz Consultant & Designer ♢ PhD in Computational Ecology ♢ #rstats #ggplot2 #figma ♢ #graphics #maps #ddj #design ♢ he/him
Jon Schwabish @jschwabish
24K Followers 994 Following 📈Economist & DataViz 🕸@urbaninstitute @PolicyViz 🎙PolicyViz Podcast 📺YouTube step-by-step tutorials 🗞On Substack: https://jschwabish.subst 👀All views mine
Andy Kriebel @VizWizBI
34K Followers 2K Following Global Head Coach @ The Data School | Tableau Visionary HOF | Training the next generation of great data analysts. Tweets & threads to help you be great too.
Cole Knaflic @storywithdata
35K Followers 775 Following Helping people create graphs that make sense, present powerfully. CEO & author of #daphnedrawsdata, #storytellingwithyou, #SWDbook & #SWDletspractice!
Pradeep Kumar G @pradeep_zen
6K Followers 896 Following 4x Tableau Public Ambassador / #IronViz'21 Finalist / 2x Vizzie Awards / 12x #VizOfTheDay / #IIBAwards'22 Bronze / 2nd Most Favorited Author on @TableauPublic
JasonForrest @Jasonforrestftw
7K Followers 970 Following https://t.co/tUp3q8hcyI Ex-McKinsey Data Visualization Lab, Editor-in-chief of Nightingale, Electronic Musician. https://t.co/6OqWYBRFs0
Tristan Guillevin @ladataviz
6K Followers 485 Following 1/2 of https://t.co/bhhqfCdjl5 ▵ Export your @figma desing to @tableau in one click: https://t.co/iNmH38rLhI 💌 Weekly news: https://t.co/fFtiLoGo49
Sarah Bartlett @sarahlovesdata
16K Followers 4K Following 5 x Tableau Visionary | 6 x Tableau Ambassador | #LondonTUG | Founder of #IronQuest, based on #IronViz | #datafam | #data24 | https://t.co/ATPjQrYScf
Lisa Charlotte Muth @lisacmuth
35K Followers 729 Following Formerly @lisacrost. Creating & writing about dataviz for @datawrapper. #visber & @datavisclub organizer. Also over there: @[email protected]
Shirley Wu @sxywu
33K Followers 736 Following chinese-american artist, software engineer, dataviz designer, keynote speaker, published author && a work-in-progress learning to take up space ✨
Alli Torban @AlliTorban
9K Followers 988 Following 📕 Author of Chart Spark 📊⚡Information Designer and Senior Data Literacy Advocate 🎙 host Data Viz Today podcast
Information is Beauti.. @infobeautyaward
16K Followers 2K Following The year's finest data visualization & infographics, judged by the public and a panel of 40+ dataviz experts. Presented by @DataVizSociety.
Evelina Judeikytė @parabolestudio
4K Followers 1K Following Data storytelling for mission-driven orgs 🎯 Founder of Parabole Studio 📡 Learn data storytelling with me 👉 https://t.co/fVmB5ujjCI
Lindsay Betzendahl @ZenDollData
11K Followers 2K Following 5x #TableauVisionary, 5x @tableau Public Ambassador | 11x VOTD | @vizhealth, views are mine | Creatively #ADHD | #projecthealthviz #momswhoviz #datafam #data24
Adewale opeyemi Samue.. @Adewale80739786
25 Followers 565 Following

DansDataLearning @DataDans44041
0 Followers 18 Following
FUGAZI- FuckedUpGotAm.. @UpAmbushed
3K Followers 4K Following "Y'a toujours un connard..."⭐⭐ IN GIF WE TRUST #Human #CHTI #NousNoublieronsRien Il ne suffit pas de se mettre une plume dans le cul pour ressembler à un coq. ✊

Justice Innovation La.. @Lab4Justice
416 Followers 623 Following Building data-informed, human-centered solutions for a more equitable, effective, and fair justice system. #Lab4Justice #data4good #justice
[email protected] @Nzephiriny23709
0 Followers 72 Following
Sumit Poddar @uncertain_sumit
0 Followers 4 Following 36,500 days on Earth! so, I wanna learn some stuff, experience some, & understand some
madlamini🦋 @_noshly
1K Followers 965 Following
Ranjan Marathe @6C1_16
286 Followers 642 Following Dad, partner, software professional, reader, music lover, fitness enthusiast, note taker.
MEHMET @xmehmet50514
121 Followers 2K Following
walkrrr 🇱🇾 وو.. @Walkrrrrrrr
145 Followers 151 Following John 3:3 Ex-Talent Acquisition Pro. Data nerd. SE Queens forever! Views are my own.
Ares Biescas @aresBiescas
2K Followers 3K Following Journalist | Coordinadora de @EFEVerifica en América Latina | #EFElaCaixa en Colombia y Barcelona | Siempre @laRutaQuetzal | OSINT🕵️♀️ |
Turtles all the way d.. @turles_atwd
9 Followers 157 Following

Dartmouth Arts and Sc.. @dartmouthartsci
349 Followers 684 Following Pushing the boundaries of discovery and creativity while delivering a transformative liberal arts education.
Bivash Barua @bivashone
4 Followers 68 Following National Design Editor @ The Indian Express. Artist, Creative Director, Photographer, and enjoys life on two wheels 🏍
Herbie @MartyMacn
81 Followers 287 Following
Sophia Jones @Sophia_MJones
16K Followers 10K Following @HRW Digital Investigations Lab. Award-winning journo & researcher investigating war crimes & human rights violations. Wandering Wisconsinite. DM for Signal.

Mantvydas Lopeta @LopetaMantvydas
8 Followers 282 Following
Hugo Arévalo @HArevaloLimon
32 Followers 290 Following
aureorios.psico @acriosnt
14 Followers 276 Following
Jocelyn Shek @jocelyn_shek
185 Followers 246 Following she/her - 19 - venn diagram enthusiast. sociology + stats @ harvard '27 but i mostly tweet about theatre
Laura Tamayo @lautamayo07
161 Followers 420 Following Solo tweets esporádicos (el 90% provienen de mi melomanía)
chakify @chakify
593 Followers 353 Following build product + tech teams | @harvard @mit @medialab | https://t.co/67g7DKffBf
Axis @axonometricview
23 Followers 119 Following
Abdulhamid Imran @ImranWunju
0 Followers 6 Following
Solola babatunde @tunedeysnoopy
219 Followers 5K Following STATS FASHION COLLECTION is a fashion world of modern design of leather belt,shoes,treckers,birkenstock,palm with a remarkable recommendations.
Rey @anoldschoolboy
88 Followers 671 Following Khushiyon se jyada na hai kisika irada ..Aaja khud ko rihaa kar lein.
Oyerinde oyesina @OyerindeOyesina
1K Followers 2K Following Product | ARCHITECT | Volunteer @dev_careers | Volunteer @the_internplace | Ambaassador @ https://t.co/3mTBP3RY7b
generationux @generationux
3 Followers 237 Following

Dominion @Johnery_19
360 Followers 2K Following Industrial chemistry by degree| Data Analyst| aspiring Frontend Developer
Luis E. (aka Don Ludo.. @luisemilio1704
60 Followers 1K Following En permanente cambio. Perdí mi cuenta anterior.


Dr. Mike Enwere @mickky89
241 Followers 247 Following Clinical Research Fellow@ Nemours Children's Health System ★ Infectious Disease Expert
simisani ndaba @simisani10
99 Followers 107 Following join me @ https://t.co/AOYaOa0FtC @RLadiesGaborone #RStats #dataviz

White Rock @W__rock__
82 Followers 339 Following

Bálint Gyevnár @CubeCC
108 Followers 344 Following PhD @ Edinburgh on safe and explainable AI \\ XAI; autonomous agents; 日本語; volleyball
Majid Jangani @Jang_maj_
17 Followers 144 Following

Seyed Parsa Neshaei @seyyedparsa
452 Followers 3K Following CS PhD Student at the Swiss Federal Institute of Technology in Lausanne (EPFL). Researcher in the intersection of HCI, NLP, ML, and digital education.
yang guang @aristotle2288
5 Followers 432 Following
Cintra Jaggernauth @Cintra_Data
56 Followers 65 Following Data Analyst | Tableau | SQL | Excel | UF Alumna '23
Nadieh Bremer @NadiehBremer
48K Followers 579 Following Data Visualization Artist (+ graduated Astronomer ✨) with a love for Data & Generative Art | 🇳🇱 https://t.co/2QeuXCOGlo
Federica Fragapane @fedfragapane
20K Followers 1K Following Information designer based in Italy. Works in the Permanent Collection of MoMA 🔗 https://t.co/ggpM8XORDO
Alberto Cairo @AlbertoCairo
68K Followers 5K Following For news, follow me on BLUESKY: https://t.co/nN8zwUEmZs and LINKEDIN: https://t.co/BV7fInzN6w
Kevin Flerlage @FlerlageKev
16K Followers 3K Following Tableau Evangelist/Data Visualization Consultant at Moxy Analytics | 5X Tableau Visionary | 5X Tableau Public Ambassador | One Half of the Flerlage Twins
Tableau #Data24 @tableau
178K Followers 3K Following Tableau helps people see and understand data. We 💙 our #DataFam. Tableau Conference April 29-May 1 #Data24
Jon Schwabish @jschwabish
24K Followers 994 Following 📈Economist & DataViz 🕸@urbaninstitute @PolicyViz 🎙PolicyViz Podcast 📺YouTube step-by-step tutorials 🗞On Substack: https://jschwabish.subst 👀All views mine
Cole Knaflic @storywithdata
35K Followers 775 Following Helping people create graphs that make sense, present powerfully. CEO & author of #daphnedrawsdata, #storytellingwithyou, #SWDbook & #SWDletspractice!
Pradeep Kumar G @pradeep_zen
6K Followers 896 Following 4x Tableau Public Ambassador / #IronViz'21 Finalist / 2x Vizzie Awards / 12x #VizOfTheDay / #IIBAwards'22 Bronze / 2nd Most Favorited Author on @TableauPublic
JasonForrest @Jasonforrestftw
7K Followers 970 Following https://t.co/tUp3q8hcyI Ex-McKinsey Data Visualization Lab, Editor-in-chief of Nightingale, Electronic Musician. https://t.co/6OqWYBRFs0
Sarah Bartlett @sarahlovesdata
16K Followers 4K Following 5 x Tableau Visionary | 6 x Tableau Ambassador | #LondonTUG | Founder of #IronQuest, based on #IronViz | #datafam | #data24 | https://t.co/ATPjQrYScf
Lisa Charlotte Muth @lisacmuth
35K Followers 729 Following Formerly @lisacrost. Creating & writing about dataviz for @datawrapper. #visber & @datavisclub organizer. Also over there: @[email protected]
Shirley Wu @sxywu
33K Followers 736 Following chinese-american artist, software engineer, dataviz designer, keynote speaker, published author && a work-in-progress learning to take up space ✨
Alli Torban @AlliTorban
9K Followers 988 Following 📕 Author of Chart Spark 📊⚡Information Designer and Senior Data Literacy Advocate 🎙 host Data Viz Today podcast
Information is Beauti.. @infobeautyaward
16K Followers 2K Following The year's finest data visualization & infographics, judged by the public and a panel of 40+ dataviz experts. Presented by @DataVizSociety.
Evelina Judeikytė @parabolestudio
4K Followers 1K Following Data storytelling for mission-driven orgs 🎯 Founder of Parabole Studio 📡 Learn data storytelling with me 👉 https://t.co/fVmB5ujjCI
Sam Parsons @SParsonsDataViz
6K Followers 1K Following Biztory: https://t.co/mnjU9EJ4x9 | Tableau Visionary & former Zen Master | Iron Viz '21 Global Runner-up | Views are my own
Ken Flerlage @flerlagekr
14K Followers 1K Following Tableau Evangelist & Consultant at Moxy Analytics | Tableau Visionary Hall of Fame | One Half of the Flerlage Twins | Ally 🏳️🌈🏳️⚧️
Neil Richards @theneilrichards
8K Followers 1K Following Tableau Visionary Hall of Fame & Public Ambassador | Global Data Fluency @JLL | https://t.co/q1nvEnM4QD | Questions in Dataviz book released Nov 2022
Ben Jones @DataRemixed
15K Followers 3K Following Founder & CEO @dataliteracycom, author of Data Literacy Fundamentals https://t.co/5j23m0lirz & Learning to See Data https://t.co/WilvUprjpB. Love nature over tech
Craig Taylor @CraigTaylorViz
12K Followers 791 Following Data Visualisation Design Manager @Itoworld
Hailey Hannigan @HaileyHannigan
64 Followers 252 Following Comms Director at Data Visualization Society Stuck in the collage-making child to data viz adult pipeline
Will Careri @WCareri
417 Followers 353 Following Nightingale Managing Editor @DataVizSociety. Award-winning communicator. #TempleMade #MICAMade
Laava @Laava_S
29 Followers 31 Following I am a personal growth/spirituality geek that loves animation, branding, and design. I help people solve their problems visually.
Silvia Canelón is on.. @spcanelon
2K Followers 735 Following Now at https://t.co/pgYyfzXO8E. Data analyst @ Penn Urban Health Lab. PhD biomed eng & informaticist. #RStats #RSpatial. she/her/ella 🇻🇪
Jessica Hullman @JessicaHullman
8K Followers 773 Following Ginni Rometty Prof @NorthwesternCS. Statistical decision theory, Visualizing & modeling uncertainty, Algorithmic implications. Occasional blogger @statmodeling

Brittany Fong @BFongData
3K Followers 673 Following Founder of BFongData • Data Visualization • Design • Former @Tableau Ambassador • Former @DataplusWomen • Former #dctug • she/her
Priya Padham @p_padham
4K Followers 2K Following 2 x Tableau Visionary | 4 x Tableau Public Ambassador | Tableau Public Featured Author '20 | Notable Newbie #Vizzie '20 | 6 x #VOTD | @ExpediaGroup
Dzifa 👩🏾💻.. @datadzif
3K Followers 2K Following tableau social ambassador • certified gif enthusiast •💖data, bubble tea, memes, & bad reality TV🤩 • tweets about tableau + data viz + random • she/her 🇬🇭✨
Jeffrey Shaffer @DataPlusScience
36K Followers 2K Following Author, Data Viz Professor, Tableau Zen Master, Data Mining Geek, Recovering Musician. https://t.co/hOwQg4AtRS●https://t.co/Z8JTLTF9Uj●https://t.co/kwD0HbViH2
Ann Jackson @AnnUJackson
8K Followers 3K Following CAPS LOCK FAN | #Tableau Visionary HOF | Analytics Strategist | 😻 #catmom to Starly, Pascal, & Joule | #author of things | #aiart generator | 🏜
Amanda Patist @amanda_patist
3K Followers 3K Following Data Experience Designer | Director of Community @ Viz for Social Good | Alumni @dataschooluk | views my own
Andy Cotgreave @acotgreave
18K Followers 1K Following Tableau evangelist + data communicator. Newsletter: https://t.co/OMuuEiRcbB More likely to be here: https://t.co/9Jfw6GyQli
Mick Yang @mick_yang
469 Followers 677 Following 🇸🇬🏳️⚧️he/him. outreach & advocacy | civic data partnerships @konti_sg 🐢🌏
Loud Numbers @loudnumbers
1K Followers 179 Following Turning data into sound and music, by @miriamquick and @duncangeere Loud Numbers podcast: https://t.co/sGsqqA1rOt

Emily Kund @emilykund
5K Followers 3K Following Visual analytics & accessibility consultant | @thefringefest Founder | volunteer | EmpowHER Magazine coming soon!
Duncan Geere has left.. @duncangeere
8K Followers 2K Following Information designer. Sound and vision. Low-carbon. "Move quietly and plant things." I'm on Mastodon these days: @[email protected]
@[email protected].. @JanWillemTulp
14K Followers 1K Following Hello, I create data visualizations @ TULP interactive - https://t.co/opOLGmCwV7 upcoming course: https://t.co/1jegKuDIQq @[email protected]
Piero Zagami @pierozagami
1K Followers 612 Following Data Designer. 1/2 of @marketcafemag and @encode_info
Gabrielle Merite (She.. @Data_Soul
3K Followers 451 Following Plant-addict, data junky, creative, advocate for ecosystems, cat lady and writing this in third person. ❌ NO LONGER ON TWITTER, FIND ME ELSEWHERE
Chantilly Jaggernauth @chanjagg
5K Followers 1K Following Founder of @MillennialsData • @Tableau Visionary • @DataLitProject Advisory Board • Speaker
Valentina D'Efilippo @defilippovale
6K Followers 1K Following Award winning data designer #TheInfographicHistoryoftheWorld #PoppyField #Oddityviz #Metoomentum #LondonUnderTheMicroscope #GuardianClasses #DomestikaCourses
Sarah • @codingchao.. @codingchaos
2K Followers 216 Following https://t.co/dkYhRadEeD • Javascript developer and cat herder, working on #a11y at Microsoft. Longer form thoughts at https://t.co/SAadixXpUa. She/her.
Jen Christiansen @ChristiansenJen
8K Followers 2K Following graphics @sciam • author of Building Science Graphics https://t.co/ylBhbSGpBz • @christiansenjen.bsky.social • Mastodon @[email protected]
Miriam Quick @miriamquick
3K Followers 2K Following I make things with data | 1/2 of @loudnumbers https://t.co/1adSVCbRUC | @iamabookonline w/ @stefpos is out now https://t.co/u4JhQvb8CT | https://t.co/32lLyVzIET
datacitron @datacitron
2K Followers 366 Following Julie Brunet aka datacitron • Information and datadesigner • Nightingale's Creative Director • Collage enthusiast • Fluent in GIFLéonie @tink@front-e.. @LeonieWatson
12K Followers 193 Following #Twexit strategy... Mastodon: https://t.co/qvjcmnfa3W Cohost: https://t.co/C5pJtSKnvM Microblog: https://t.co/GwypZAH23T
Øystein Moseng @oysteinmoseng
178 Followers 302 Following Chief Product Officer & Head of Accessibility @Highcharts. Loud musician.
Sarah L. Fossheim (th.. @SarahFossheim
6K Followers 933 Following Non-binary. Independent developer & designer, focused on accessibility & ethics. https://t.co/kezGo7LUjN & https://t.co/m8YueOKayh | @[email protected]
Bella 🐀 @Patcheez94
490 Followers 2K Following (she/her) doing data things @ Citymapper | proud @kontinentalist_ and @ledeprog alumnus 🕺🏻 ~on twitter hiatus~
annette hester @TheHesterView
722 Followers 720 Following Data for People. Transforming data to build a wiser and kinder world. #innovation #humanintheloop #chi #design #art #zenvirtualspaces
Stewart Butterfield @stewart
140K Followers 3K Following Slack boss • Flickr co-founder • Thought loser • ¯\_(ツ)_/¯ • I'm trying my hardest!
Kaumudi Goda (She/Her.. @KaumudiGoda
26 Followers 460 Following People, Leadership, & Culture | Law & Public Policy | Inclusion | Future of Work | Sustainable Development | *Consultant, Speaker, Author, Trainer, Coach*
jennifer daniel @jenniferdaniel
15K Followers 1K Following Unicode ESC, Chair: 🥹🫠🫥🥲🫡🫢🫣😮💨😵💫😶🌫️❤️🔥❤️🩹🫦🫧🫗🪬 | Emoji Kitchen Chef 🧑🍳 | https://t.co/EYn9XPVsOC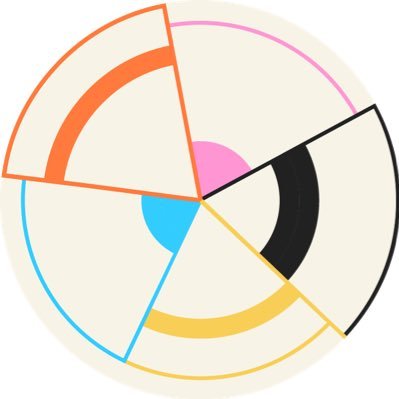
Data Suffragettes @DSuffragettes
1K Followers 290 Following We are a collective of international women passionate about data visualization.
Simran Parwani @simranparwani
2K Followers 1K Following 📊🪴☕️🏈🤷🏽♀️ unlearning && reframing && making charts @axiosvisuals // “sim-rin” she/her
Nathalie Vladis @NathalieVladis
42 Followers 100 Following Founder of ModON the Model Organism Network, PhD student at the University of Edinburgh
Jarrett Hurms @JarrettHurms
2K Followers 2K Following Analyst by Day | Analytics Prof by Night | Co-Chair for TSAC | Chair of CAB for @WFAE | W-S to PHL to CLT | Views Stated Here are My Own (He/Him)
Dr. Ruth Agbakoba �.. @RuthAgbakoba
3K Followers 3K Following @NHSEngland, Vegan 🌿Postdoc 🇺🇲 Digital Health Equity, Racial Justice ⚖️ PhD Health Innovation @UofGlasgow Co-Founder #BlackInData #BlackLivesMatter
RealScientists @realscientists
85K Followers 3K Following Real Science, from Real Scientists and other STEAMM Professsionals
Dr Simone Webb @SimSci9
4K Followers 1K Following Coder & academic 🧬 Defying RA 🇯🇲 LDN-JA @ACRC_UK 🤵🏾 Views mine ✨ she/her
Global Knowledge Init.. @GKInitiative
2K Followers 2K Following Our mission is to activate collaborative networks globally to deliver the innovative solutions needed to build more resilient systems.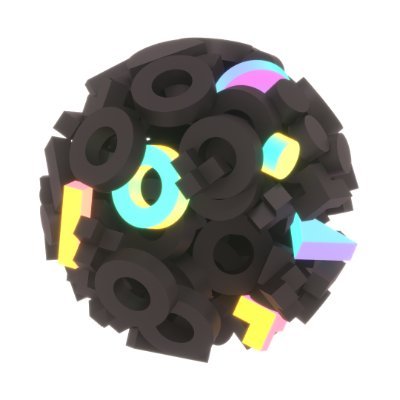
OutlierConf @OutlierConf
4K Followers 630 Following @DataVizSociety conference that aims to nurture, celebrate, and advance the global data visualization community. #Outlier2023
Youyou Zhou @zhoyoyo
3K Followers 1K Following Graphics reporter @PostOpinions ✍️ immigration & global migration. Prev: data and visual things @voxdotcom, @qz, @ap. @DCrit #Mizzou alum
Alana Pirrone @alanapirrone
228 Followers 451 Following Design and Communications Coordinator at University of Melbourne. Design and Data Visualisation Consultant. Views are my own
@devilsattorney @DataVizSociety Many many thankss 😅❤️ i really appreciate you let me know
@matplotlib colormaps visualized as trajectories through 2D RGB space. Inferno, Viridis, Cool, HSV #ChartDay @DataVizSociety
Check out the scatter plot attached to my newest piece, where you can explore how housing affects school integration by changing housing metrics for the y axis and filtering by the share of students attending school in their own neighborhood. #ChartDay housingmatters.urban.org/feature/school…
Here are some of my charts for @rapplerdotcom. From politics to sports 📊🤓
Calling all data enthusiasts to celebrate International Chart Day! Share your chart or one your admire on social media today. Follow DVS, tag us, and include #ChartDay to have your work reposted.


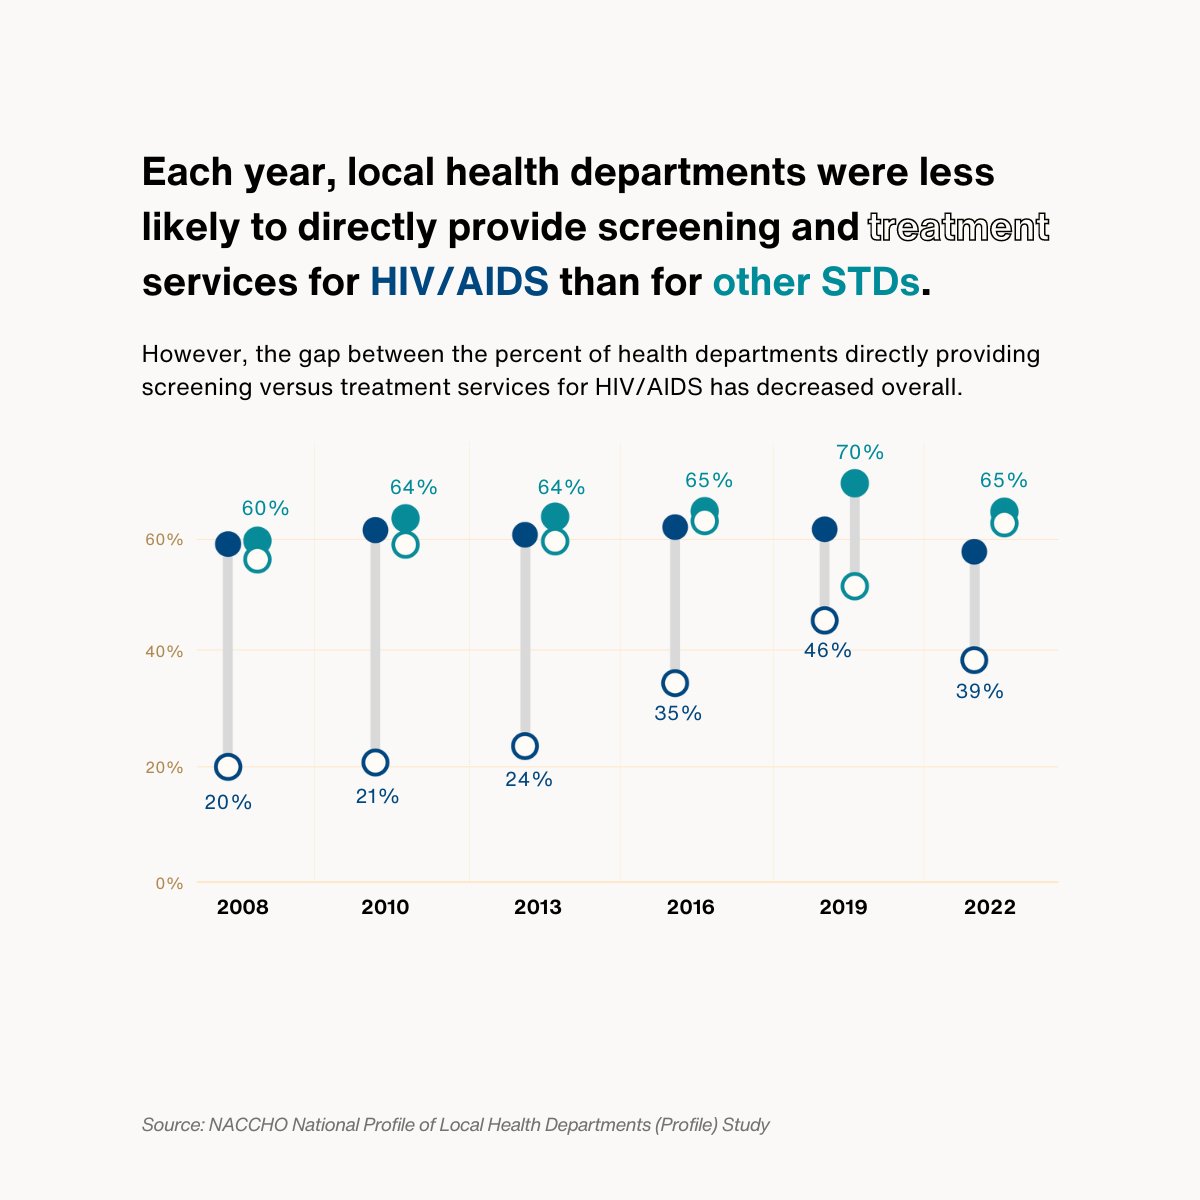
This #STIWeek, check out our data on local health department services for STDs. #NACCHOProfileStudy shows how service provision has changed over the past decade. Follow along on LinkedIn this week as we share more #DataViz highlighting our #STI research: linkedin.com/showcase/nacch….

For International #ChartDay, I'm sharing a fun project I created to help Tekken players learn the game mechanics. I visualized a very small subset of the data using cards, so you can easily move them around to create your own categories. janezhang.ca/work/tekken/


If @DataVizSociety says it's a chart day - It IS a chart day 📊. Go on - showcase your best work💪. And don't forget the tag❗ #ChartDay
Celebrating international #ChartDay with @DataVizSociety Composition of sanctions by nationality of sanctioned individuals, and how many individuals of a given nationality are subject to financial sanctions or travel bans. Data: data.europa.eu #rstats #dataviz

Hey, check out my latest #dataviz, 🅦🅗🅞🅓🅤🅝🅝🅘🅣? Today, you are the detective🔎 Use this dashboard to choose a victim was and a crime setup, and unveil the murderer's profile: gender, age and motive! #AgathaChristie @DataVizSociety #ChartDay #Tableau public.tableau.com/app/profile/ir…

Sharing my “Press Freedom Index” viz for #ChartDay 😃


Registrations are still open for May #FutureFridays—learn how you can apply emotion to create impactful dataviz! Full details here: infogr8.notion.site/Future-Fridays…
We’ve partnered with @infogr8 for #FutureFridays to develop #dataviz solutions to social challenges. You’ll dive into the use of emotion in data communications and how you could incorporate it into your data visualisation projects. Join here: buff.ly/42KHbpH


Petition to make #ChartDay a local holiday in Dundee -the city where many modern charts were invented. Whilst I await a decision I'll be taking the day off.
Calling all data enthusiasts to celebrate International Chart Day! Share your chart or one your admire on social media today. Follow DVS, tag us, and include #ChartDay to have your work reposted.
Celebrating International #ChartDay with @DataVizSociety observablehq.com/d/9567c8728038…


#30DayChartChallenge | #Day12 | #Reuters Based on @guardian , the cost of living has been the most important issue among Australians who voted in 2022. What are the other important issues? Explore more here: public.tableau.com/app/profile/di… theguardian.com/commentisfree/…


Calling all data enthusiasts to celebrate "International Chart Day". Share a chart you've created or admire to celebrate International Chart Day! #ChartDay Don't forget to include a link to the work and credit the author if you're not the creator Happy sharing! Happy…

It's International Chart Day and I want to share one of my favorite charts ever - the Law & Order Universe network diagram from @flerlagekr. I love this so much! @DataVizSociety #ChartDay Link: public.tableau.com/app/profile/ke…


It’s been an honor getting to know Jason as part of @DataVizSociety and learning about his innovative work in data viz 📈🏆
As some of you may know, the Data Visualization Lab team is leaving @McKinsey . While it is a difficult time - it also is an exciting time - as this opens new opportunities for me and the team. /1

Dear Analyst ep. #126: Executive director of the @DataVizSociety @abmakulec talks about data storytelling. She talks about creating COVID charts with Johns Hopkins Center for Comms and what questions to ask when creating a #dataviz. ow.ly/6Bxj50Rg635

💫 NEW! Satellite imagery is widely used to show geographical details, but how can it be used for data journalism and how did we get to this point? Join @rsimmon for Nightingale, @DataVizSociety, on an in-depth exploration of how space becomes stories. gijn.org/stories/from-s…
Trends for United States
You might like