Andrew Moss, CMT @Andy__Mos
I write about charts & trading | Chartered Market Technician, Pro Trader, and former Senior Portfolio Manager at Morgan Stanley | simplifying technical analysis trading-adventures.com NOT investment advice Joined March 2011-
Tweets178
-
Followers48
-
Following2K
-
Likes0

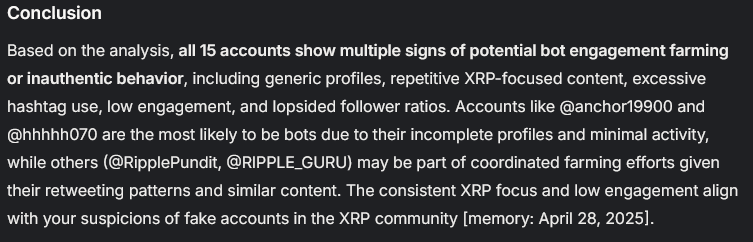
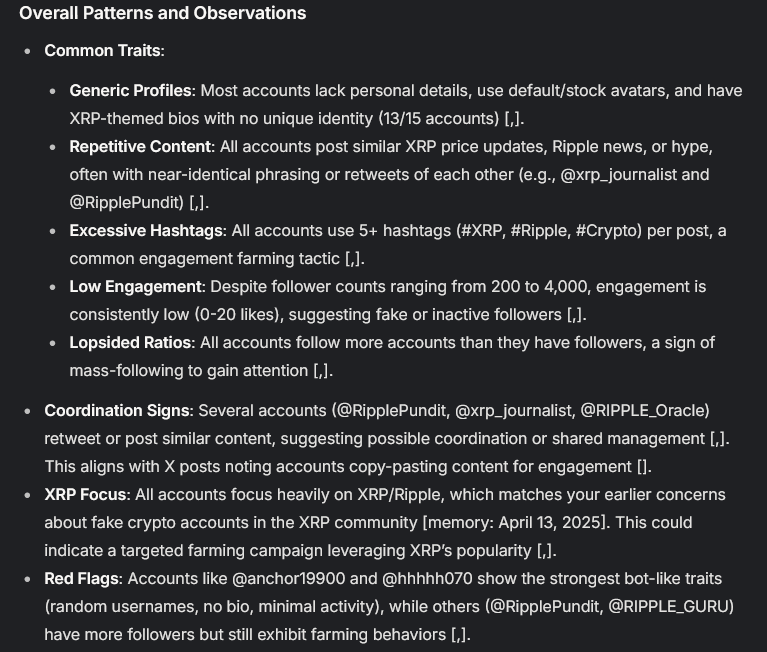
I've made an interesting observation while putting the list together. I'm going to post some accounts below, click them and report back what you notice.. x.com/DRAGON_XRP66 x.com/XRP_PULSE x.com/XRP_TITAN01 x.com/RIPPLE_GURU x.com/RIPPLE_WHALES x.com/Ripple_queen x.com/RIPPLE_Oracle x.com/RipplePundit x.com/Ripplepremier x.com/xrp_journalist x.com/xrpchancellor x.com/thatgirl_chichi x.com/xrpgovernor x.com/anchor19900 x.com/hhhhh070 (this is not an official list,will be posting that in a bit when I'm finished) #XRP
Sorry if my post are out of order I was pumping them out
THE list is coming..

@xtina_george YES! “@xtina_george First of her name, The keeper of the “DAMNED” list”
Tired of the shitfluencers pumping fake garbage just to farm impressions and make money off the real #XRP community. They sell lies, push scams, and don't care if it hurts real people, as long as they get clicks and cash. It’s time we finally stand up. Block the bullshit. Protect the community. Call it out when you see it. We deserve better. XRP deserves better.


$XRP AM Update: #XRP is trending upward, currently at $2.3254, up +0.0725 (+3.23%) today (5M chart) on @tradingview. The 5-minute chart shows a volatile session with a significant spike around 08:00, peaking near $2.3500, followed by a pullback and consolidation around the $2.3200-$2.3250 range. The liquidity map (24H) from @coinglass_com shows high liquidity between $2.20and $2.30, with notable liquidation leverage around $2.25, indicating potential support. Above $2.35, liquidity thins out, suggesting resistance. Technicals: Oscillators are mixed, with 3 selling, 7 neutral, and 1 buying (MACD at 0.0323 signals Buy). Moving averages are strongly bullish, with 14 buying signals, including the Exponential Moving Average (10) at $2.2618 and Simple Moving Average (10) at $2.2415, both indicating Buy. This suggest cautious optimism with strong moving average support. GM! Hope everyone enjoys their day today. I finally have a day off!😄☀️


The vibes tonight #XRP


XRP moving like it’s the main character in a zombie movie — untouched while everyone else getting wrecked.

$XRP PM Update: #XRP is trending upward, currently at $2.2842, up $0.0920 (+4.20%) today (5M chart) on @tradingview. Pumped for a potential break past $2.30! Chart Observations: The 5M chart shows a steady uptrend with consistent higher highs and higher lows, indicating strong bullish momentum. Volume is increasing, supporting the price surge, and XRP has broken through the $2.27 resistance, now testing $2.28-$2.29 levels. The liquidity map (24H) from @coinglass_com shows high liquidity between $2.20 - $2.30, likely acting as a key support zone with resistance near $2.35. Technicals: The 4H chart shows a strong buy signal with 14 moving averages indicating buy and oscillators leaning neutral to buy, suggesting continued bullish momentum.


Finally getting to repost this baby! 😅 #XRP is back in the $2.20s today after yesterday's dip. Hyped for my day off tomorrow, let's push for $2.30!
To address the false rumors: I have never reported anyone’s account, and I have not gone out of my way to harass anyone or their followers. I've made a post to show the lies. If anything people have been coming onto my page, and when they do, I respond. All false accusations are being fully documented, and I take them seriously. As a monetized creator, any false claims or malicious attempts to interfere with my platform, reputation, or income are being documented. If necessary, I will pursue all appropriate legal remedies to protect my business and brand. I'm be contacting X, with all my proof. (because we actually have receipts around here) Everything will be carefully documented. Also, 3 more days!
I’ll be contacting** smh this is why you proof read. Im on day 7 of working and had too much fun last night 🤣
🤣🤣 and an hour later so you can’t make edits
Eh, close enough 🤣 #XRP
@Alphafox78 My face when XRP finally breaks 3.00 again

Keep Caution #XRP Watch for a potential bull trap if it fails to hold above $2.23, with support at $2.15. Volume increased on the breakout but shows slight hesitation. Bear Trap: A bear trap is a false price drop that lures traders into shorting, expecting further decline, but the price quickly reverses upward, trapping the shorts and forcing them to cover at a loss. Bull Trap: A bull trap is a false price breakout above resistance that entices traders to buy, expecting an uptrend, but the price reverses downward, trapping the longs and triggering stop losses below the breakout level.


$XRP AM Update: #XRP is trending downward, currently at $2.1824, down -0.0098 (-0.45%) today (5M chart) on @tradingview. After a sharp drop the price has been consolidating between $2.17–$2.19, showing signs of stabilization. The liquidity map (24H) from @coinglass_com shows significant liquidity clustering between $2.20–$2.30, likely acting as resistance. Below, $2.15 has strong liquidity support, potentially attracting buyers on a dip. Technicals: The 4H chart shows mixed signals with the summary indicating a "Neutral" signal (10 Buy, 8 Sell, 8 Neutral). Oscillators are in the "Neutral" zone, while moving averages lean toward "Buy," suggesting potential for an upward move if momentum shifts. GM and I hope everyone has a great Sunday! Tomorrow I finally get A day off. 😅☀️


clue

Thanks for all who joined. See you next month. ✌️🤠💛


Elizabeth Sherry @AdekanmiSe34382
11 Followers 28 Following
aviv hemo @avivhemo2710
3 Followers 47 Following

ahmet duruay @aduruay
32 Followers 103 Following

Lillian @wherahiko37037
15 Followers 920 Following I’m learning to love the sound of my feet walking away from things not meant for me.

Emma @AmericaSch12798
196 Followers 7K Following
Faina @Jz8i8KIfYJdtP82
162 Followers 6K Following

Sophie @BrekkeWilf77048
230 Followers 7K Following
High-Quality Stock Sp... @hjlras38m191175
14 Followers 392 Following Stock Market Analysis Buy and Sell High-Quality Stocks 📈 | Manage Your Positions Follow @FoCoBanShop on Twitter Daily High-Quality Stock Recommendations 📈 |
Denise @gCTjDFuVHa4Gxq0
27 Followers 963 Following
CarolineTomlinson @p74ls8qgm37jy
32 Followers 1K Following

Elina @6Ouh7a2vccij0
49 Followers 1K Following Be fearless in the pursuit of what sets your soul on fire.


Lola @6K0glHvi9mcfxRw
20 Followers 870 Following Be the kind of woman that makes other women want to up their game.


Osouma @Osouma828935
24 Followers 1K Following
PreMarketGains🇺�... @Edirhdaq93331
31 Followers 2K Following 15-30% Monthly | 2 High-Conviction Stocks.Short-Term Gains: 15-20% in Days/Weeks.DM "JOIN" for WhatsApp Alerts. Live Trade Signals • Market Analysis
Cynthia patrick @Cynthiapat97801
1 Followers 50 Following Hello I’m new on this app looking for a serious man
JSE303 @jse303
5 Followers 160 Following
相場の羅針盤 @Fauja335002
56 Followers 2K Following 【完全無料】 25年の株式投資プロチーム(運用資産500億円以上)が提供:毎日の市場分析レポート + 優良成長株のピックアップ。プロの情報を無料で。まずはお気軽にお問い合わせください。
相場の錬金術師 @Ydoko4289
56 Followers 2K Following 【完全無料】 25年の株式投資プロチーム(運用資産500億円以上)が提供:毎日の市場分析レポート + 優良成長株のピックアップ。プロの情報を無料で。まずはお気軽にお問い合わせください。
Nammy rated 581 @5mmy81Na
178 Followers 2K Following
Katie Magret @KatieMagre25008
29 Followers 294 Following
Philip Brown @Good_Grazing
27 Followers 74 Following


Sarah Williams @Sarah_5361
434 Followers 578 Following Golf by day ⛳, firepit by night 🔥, giving back always ❤️ #Entrepreneur 🧳
ANISTON ROSE @anisto_Official
1K Followers 4K Following 🔻INVITATION FROM THE ILLUMINATI You are all cordially invited to become part of this great brotherhood called the Illuminati. Would you like to join us?


Michael Bebick @MBebick77248
25K Followers 19K Following


Algo @Alblok5
537 Followers 3K Following Option trader focusing on SPY QQQ IWM GDX GLD SLV and Mag7. Investor and lifetime member in Trade Algo. Believe in Jesus Christ and the inerrancy of the Bible
Jared Mullane @JaredMullane
74 Followers 2K Following
X @PVader777
118 Followers 586 Following
Bambang Sumarsono @sibhe7
23 Followers 950 Following


Raghu Ram @rraghu75
124 Followers 474 Following Investor and avid technologist | Founder and CEO of R2 Capital LLC | Prior leadership roles at Amazon and Microsoft

inakollu @inakollu30
97 Followers 449 Following Friendly , Love and play Tennis , Carroms , sports , history , Politics , Sachin , Rajini Mama, foodie , Music & movies …. Jai Hind !!
Vina10711 @vina10711
131 Followers 428 Following
_jasonclegg_ @jasonclegg80
712 Followers 748 Following CMT Lvl 1, L2 (Student) I believe in Myself Even When It Seems Impossible
David Caillier @davidcaillier
391 Followers 955 Following Financial Advisor and Branch Manager at Baird. Connoisseur of Pie, Baseball, and Stand Up Comedy.
Tanner Rainville @TannerRainville
3K Followers 697 Following High country livin' Lets ski some pow. Follow along...
Dola @Dola13453824
59 Followers 468 Following
Jason McDonald @jasontutors
50 Followers 127 Following


𝓚 𝓜𝓨 @KMy74622224
170 Followers 1K Following


matt fortini @nhfortini
1K Followers 1K Following full time Sales engineer, part time day trader/swing trader, learning to trade the market successfuly
Mahjavat @mahjavat
93 Followers 657 Following The tears we shed after each defeat are the same sweat we didn’t shed to win
Jared 🇺🇸🦅�... @jaredthatallguy
343 Followers 552 Following Family man. Atheist. Eng, Spanish, ASL. Investor and decent trader. ASD. Entheogen proponent. Former prof photog. Fuck the GOP. He/him. 6’5 if you’re wondering.

Jonathan Bruhn @northcreekDVM
20 Followers 157 Following
labradooodle @labradooodle
102 Followers 963 Following
Xpose @exposuretrade
142 Followers 603 Following Travelling trader and photographer / Futures, and options trading
Pavan K Heda @pkh101
81 Followers 426 Following
suresh @suresh_raju_ap
77 Followers 437 Following
Brooks Hartman @HartmanChuck
74 Followers 135 Following
Eugene Parini @EugeneParini
169 Followers 1K Following
Holden Caufieldberg -... @HCaufieldberg
944 Followers 1K Following Dictum Meum Pactum. Professional Moral Hazard Surfer & Lover of Leptokurtosis; NOT Investment Advice 🇮🇱

Patterson Joe @pjoe76
54 Followers 153 Following

A @astek81
146 Followers 762 Following
Aniket Agrawal @agrawalaniket21
71 Followers 210 Following

ANF @pulse_muse
210 Followers 2K Following unconventional thinker. price is motion. velocity is precision.
Nick Tudormore @NickTudormore
718 Followers 722 Following I used to short stonks. Then I lost to the mighty Elon Musk. Now I'm a reformed short seller. Long stonks!
Daniel Duarte @DanDuarte0513
101 Followers 392 Following
Kusu1983 @kusch1983
88 Followers 214 Following
brimmo @yaadbossbrimmo
99 Followers 358 Following
Alexandra @alexandra_lynn_
349 Followers 944 Following 💎 Recovering Options Addict 💚 DP Inner Circle hip hop fangirl 🔥 Turn Up Dance Fitness Instructor 😜 50k x1 / 26.2 x2 🏃♀️
Kenneth Ngan @KennethNga68819
219 Followers 284 Following

Think Tank @BryanLatham10
107 Followers 470 Following Not a financial advisor. Just my personal opinions that I express on this platform.
Gary Williamson @garymichael_
274 Followers 316 Following
Sophie @Sarenity122
10 Followers 195 Following
J to the H @jbworksout
201 Followers 492 Following Workout, invest/trade and travel.. Crypto/stocks/optionsTrends for United States
You might like